Recommendations
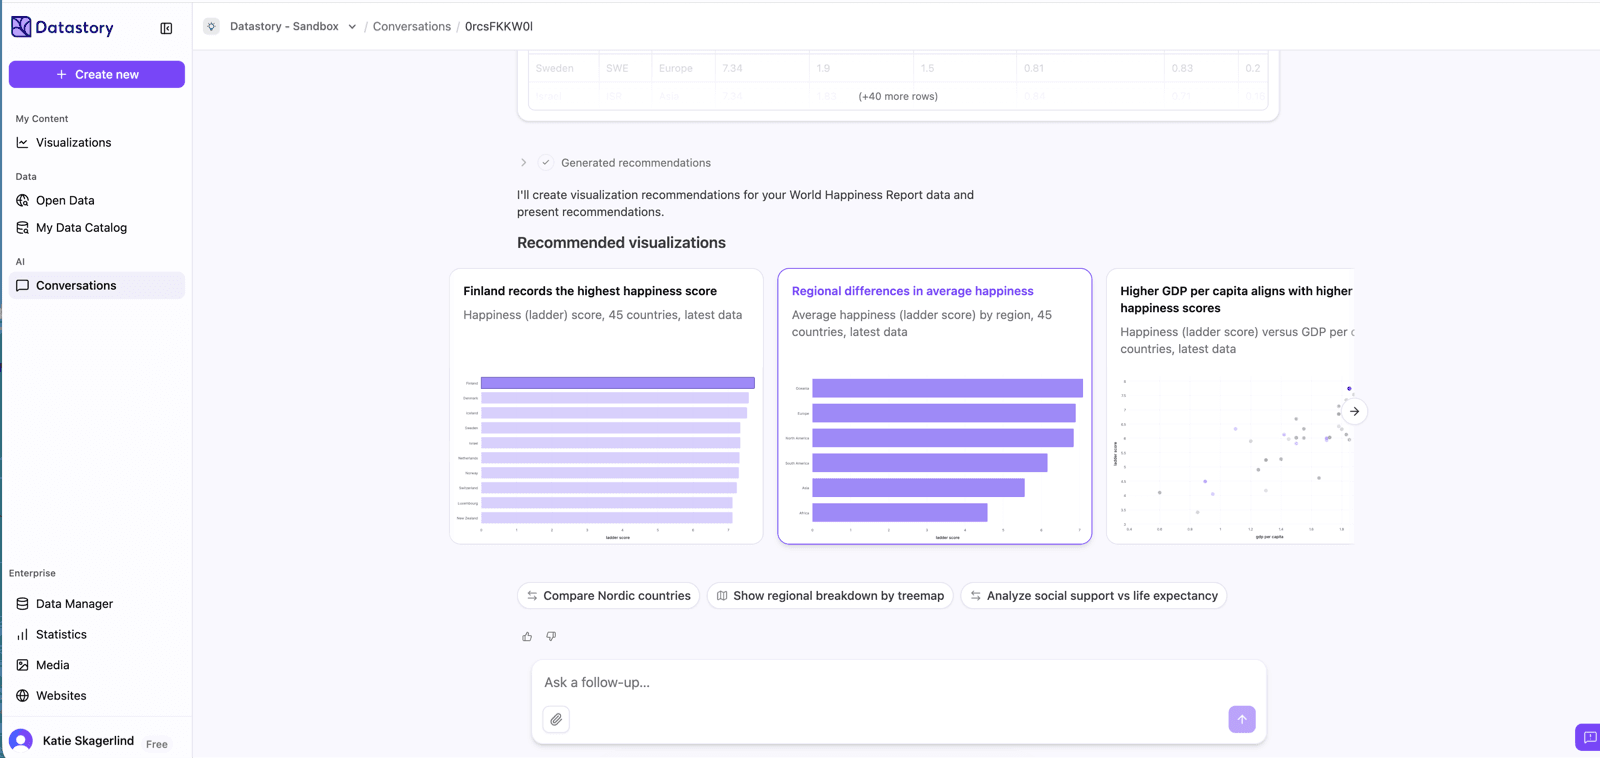
When you upload your data, Datastory generates a set of recommended charts. Each one does two things at once: it picks a chart type that fits the shape of your data and it reveals insights in your dataset.
Compare the options and open the one that best fits the story you want to tell, or keep prompting to refine the recommendations. It’s a conversation, so each message builds on what’s already there.
- Use prompt suggestions, shown as pills below the chart, as a quick way to explore the data with one click. In the example below, you can see compare Nordic countries and show regional breakdown as suggestions to further dig into the dataset.
- Type your own request in the prompt to keep shaping the result. For more information on how to get good results from prompting, visit Prompting.