
Open now · 1 to 29 October 2026
The Datastory Open
A month-long data visualization challenge. Build a visualization in Datastory, post it on LinkedIn, and win up to €500.
How to enter
Enter in three steps
It's free, and you can enter as many times as you like: every post counts as its own entry. Entries close Thursday 29 October at midnight CET.
Create a free account
Sign up at datastory.tech. Free forever, no credit card needed.
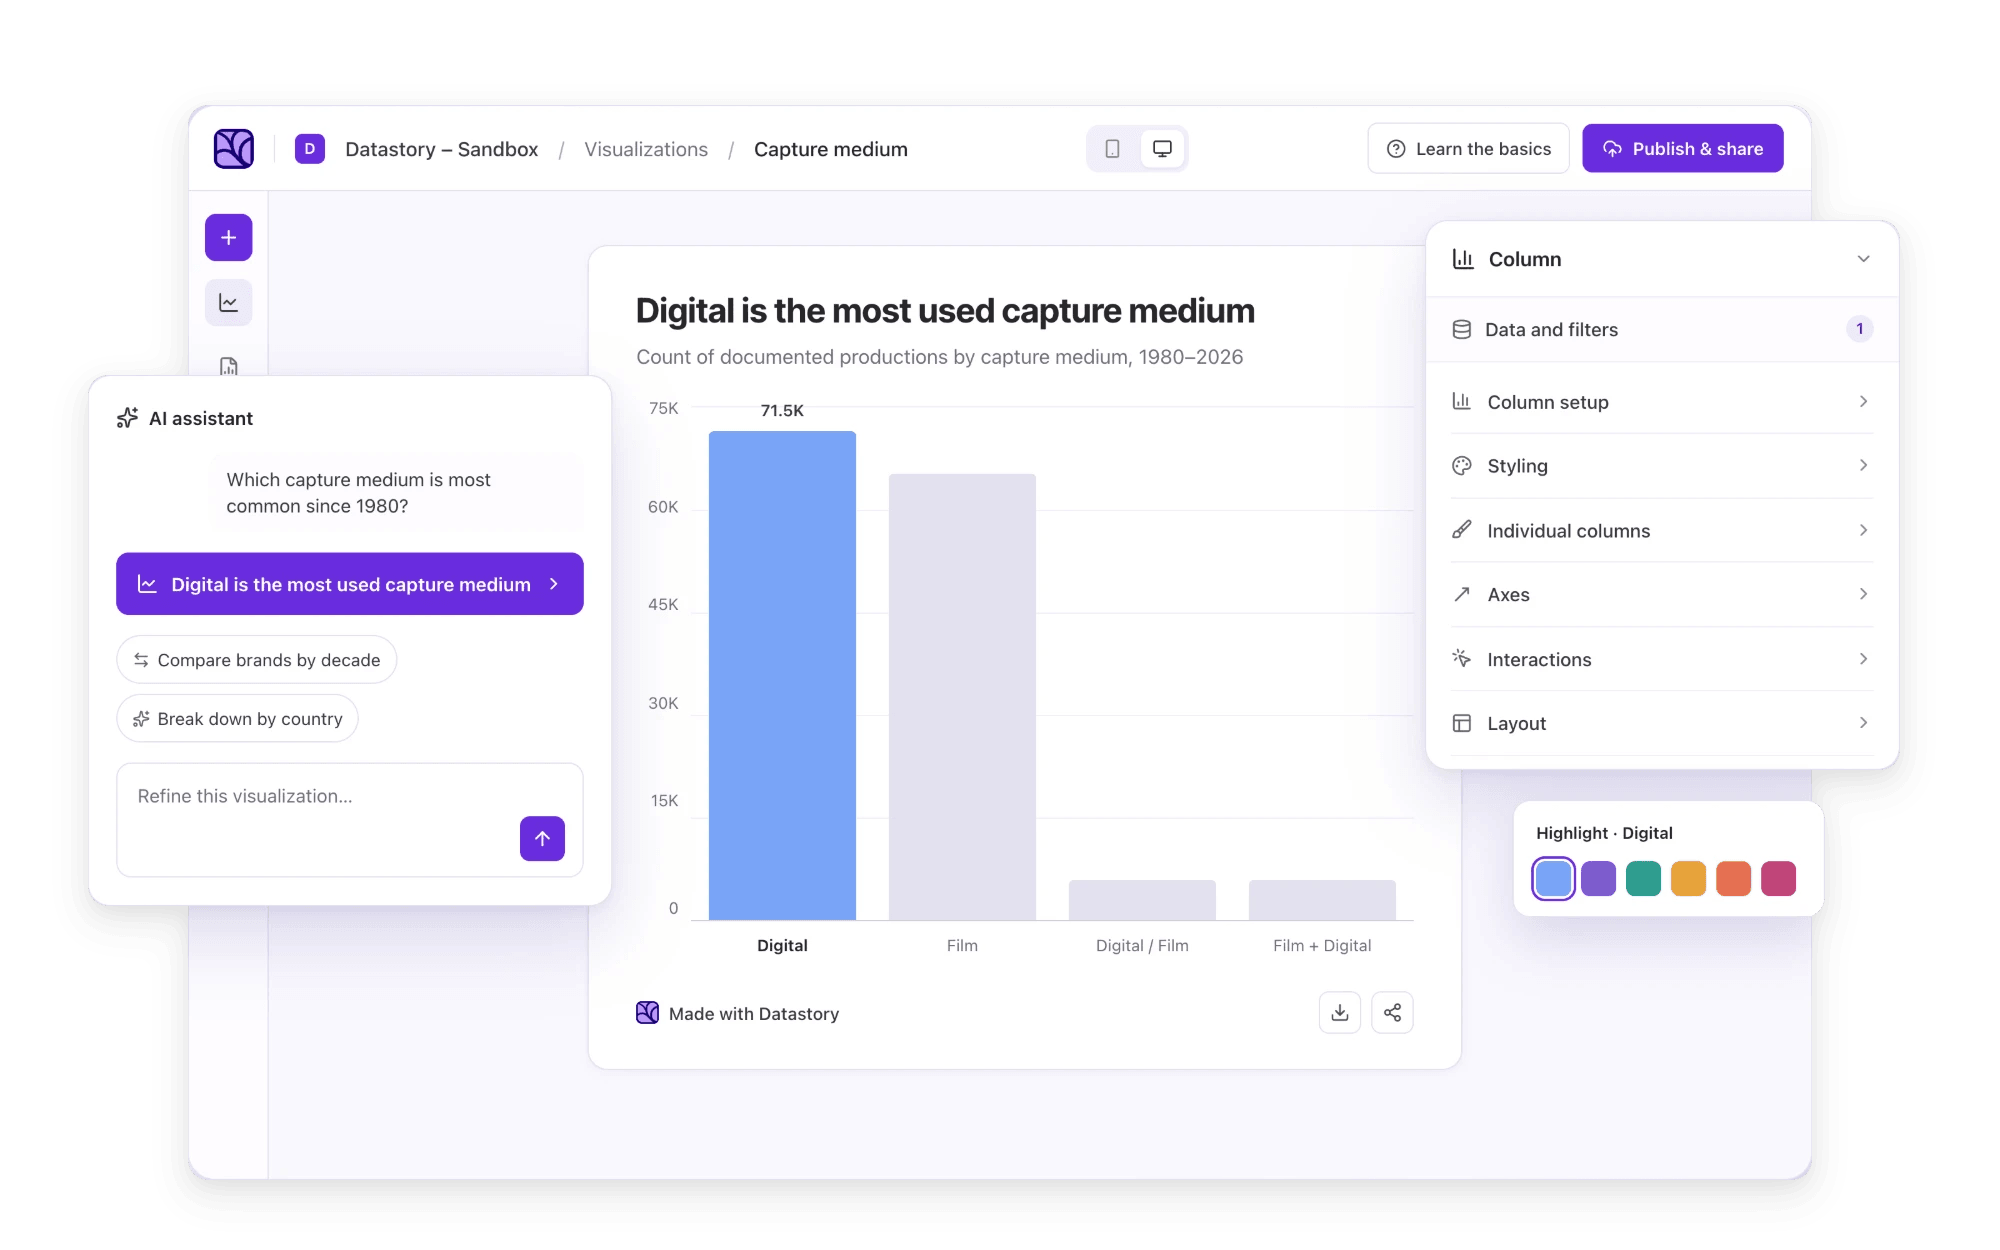
Build a visualization
Use your own data or anything from the open data library. Any topic, any chart type.
Post it on LinkedIn
Share it publicly and tag @Datastory and #MadeWithDatastory. That's your entry.
The details
Prizes and dates
Prizes
- €5001st placePicked by the judges
- €3002nd placePicked by the judges
- €200People's choiceMost likes, comments and shares on LinkedIn
Every winner also gets swag and a 1-year subscription, worth €660.
Key dates
- 1 OctContest opensThursday 1 October
- 29 OctEntries closeThursday 29 October, midnight CET
- 30 OctWinners announcedFriday 30 October
Judges
Meet the judges

Yan Holtz
Guest judge
Creator of the R Graph Gallery and the Python Graph Gallery, the references much of the data visualization world learned from.

Daniel Lapidus
Founder, Datastory
Worked with Hans Rosling at Gapminder and as a data journalist at SVT.
Your entry is a few minutes away
Sign up, pick a dataset, publish a chart. Need a starting point? Browse the examples and remix one.