Getting started
Bring a question and some data, skip the blank canvas. Start from a CSV or the Open Data Catalog and our AI suggests charts that fit your dataset and helps you uncover the insights inside it. Refine your chart and publish it wherever your audience is.
Everything in these guides can be done two ways: with the manual settings, or by describing what you want in the prompt. Use whichever you prefer, or mix them.
Examples to explore
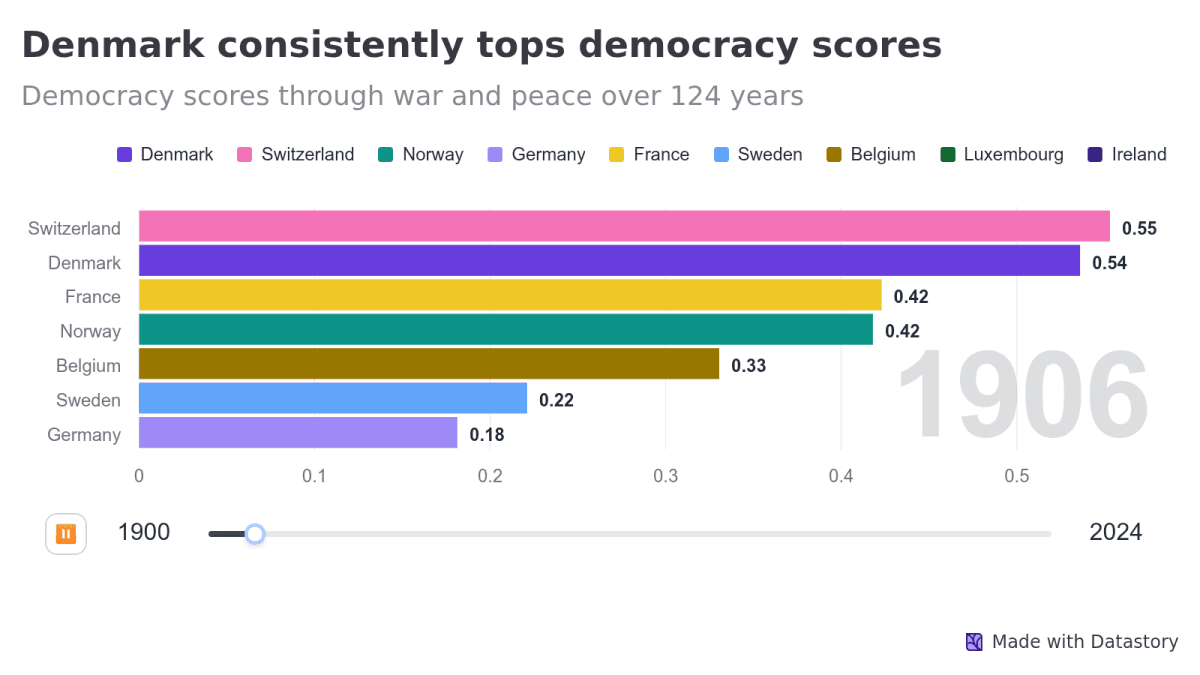
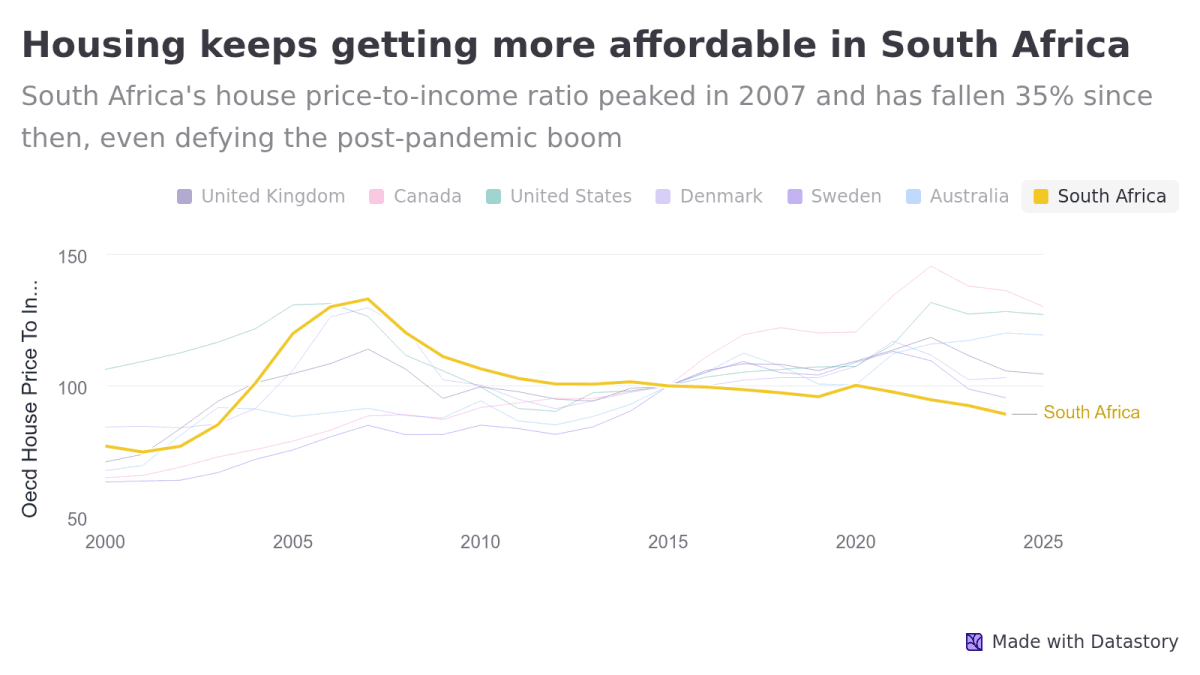
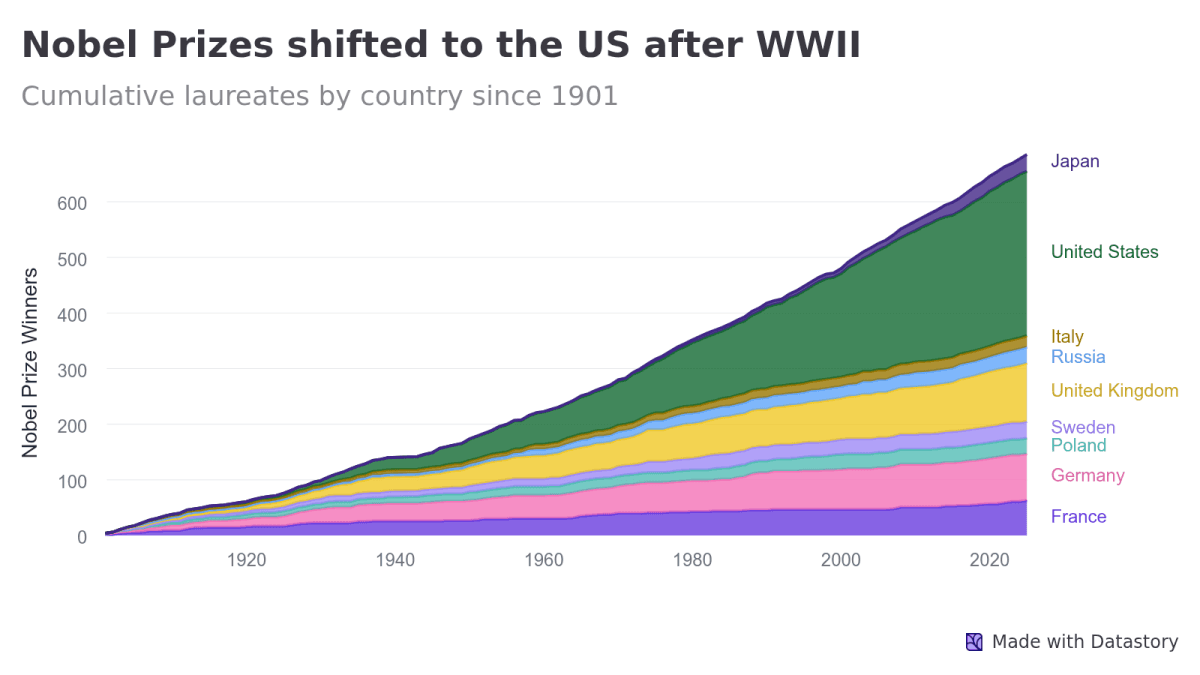
Real data, real charts and zero setup, all from Datastory’s Open Data. Prompt the catalog or search by keyword, source, or topic to find what you need fast.