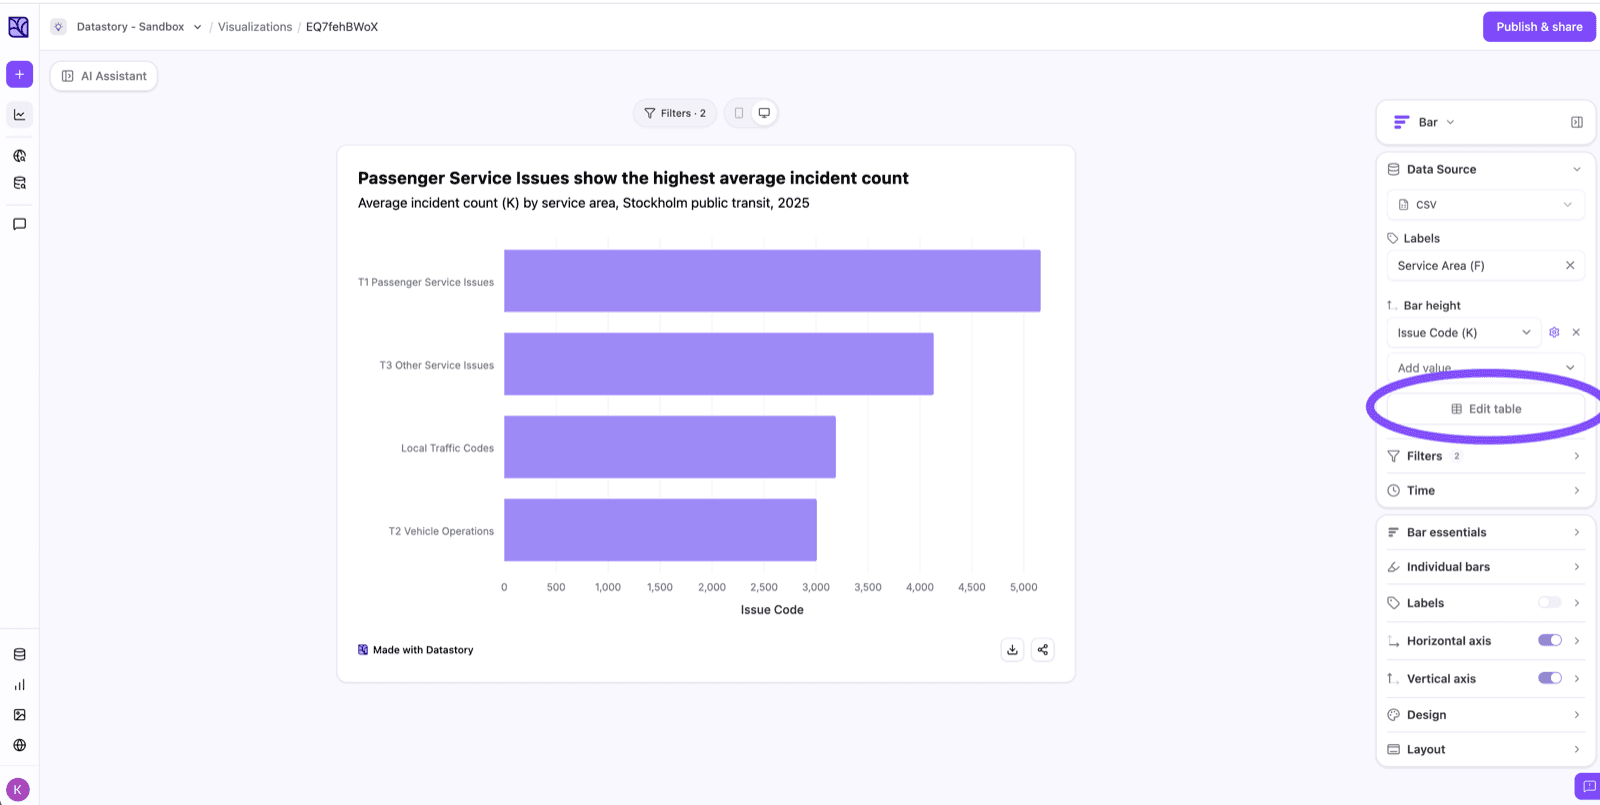
Data table
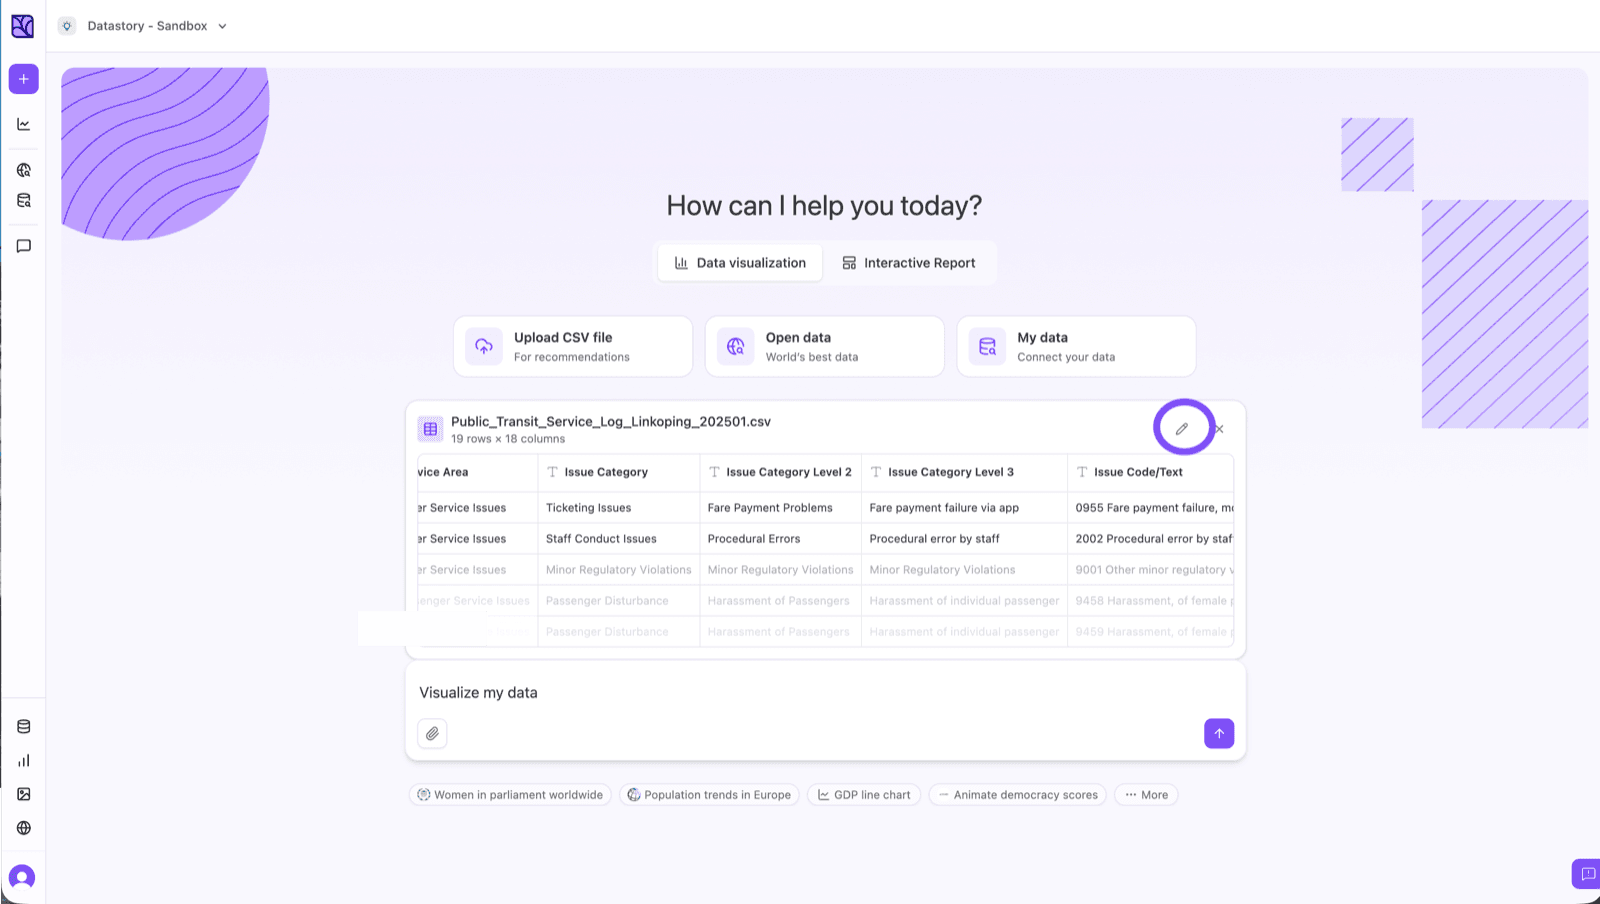
After you upload a file, Datastory opens it in a data table so you can check and clean it before visualizing your data. This is also where you fix any warnings, like a column whose values don’t match its detected type.
Click on the pen to get started with editing the table!
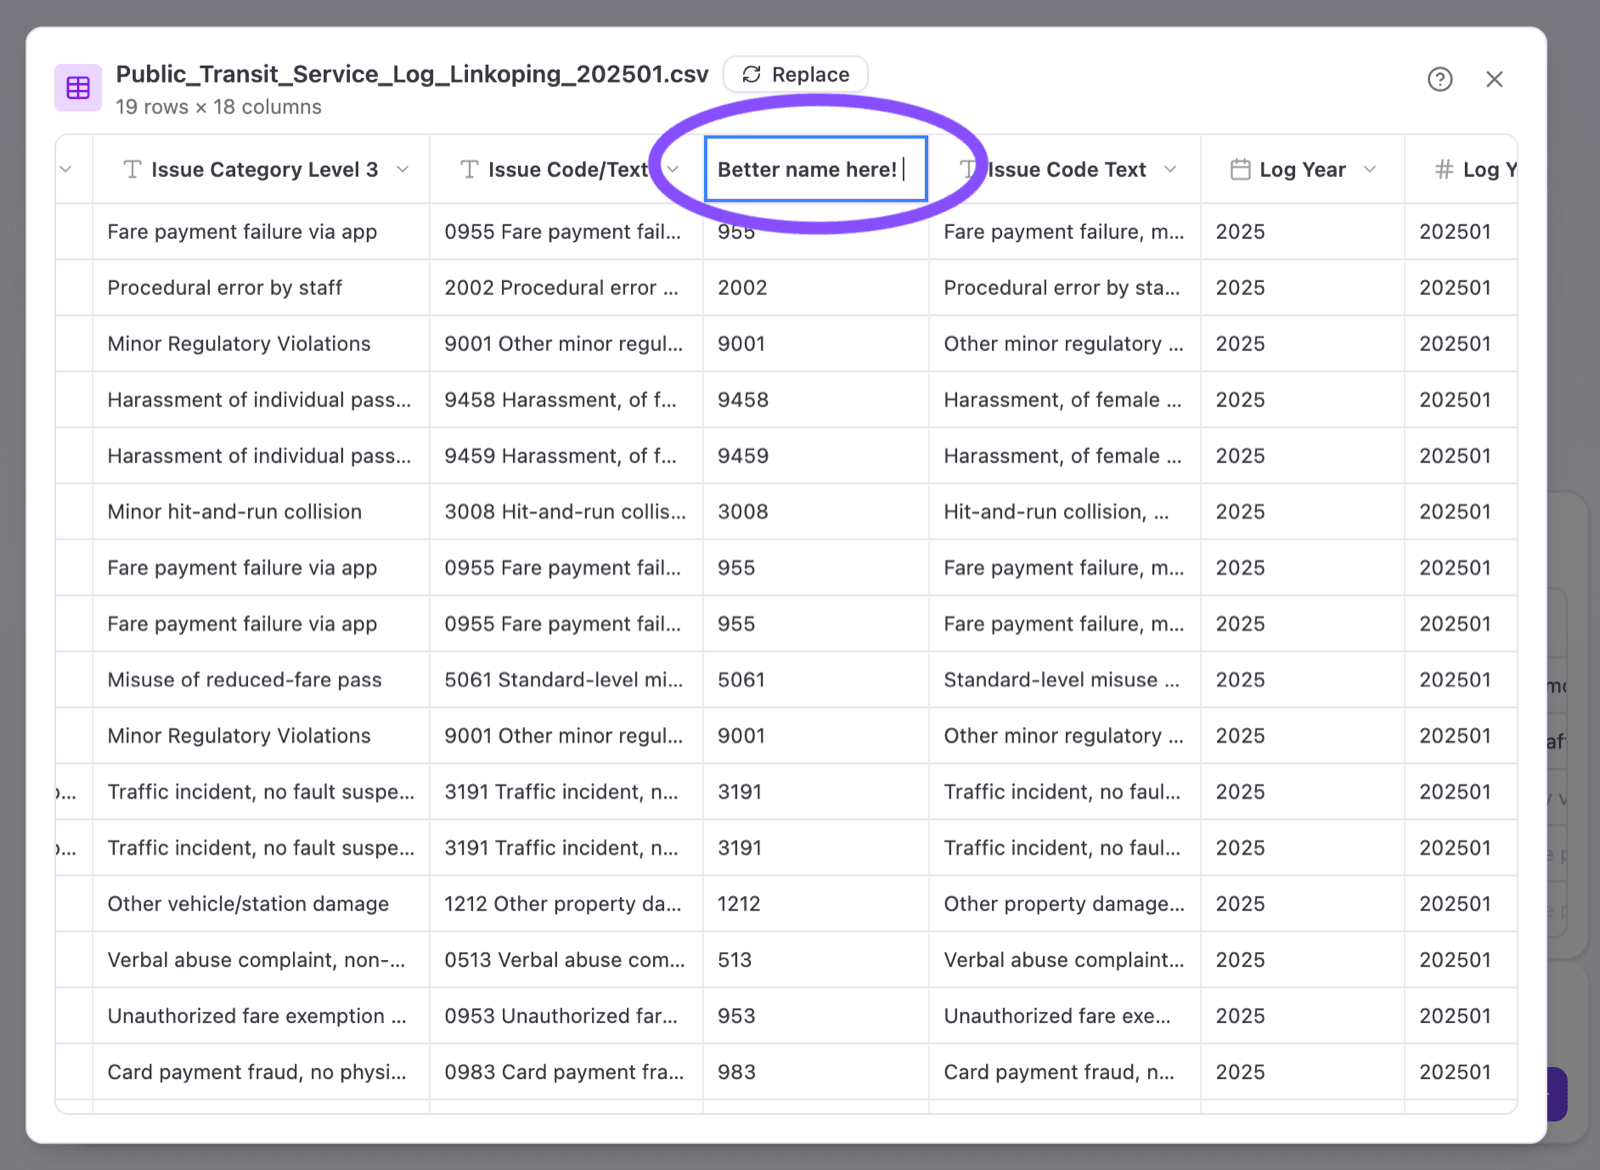
Edit values and headers
You can edit your data directly in the table, there is no need to go back to your original spreadsheet. Click a cell to change its value or click a column header to rename it. This is useful for tidying up a label or giving a column a more clear or descriptive name.
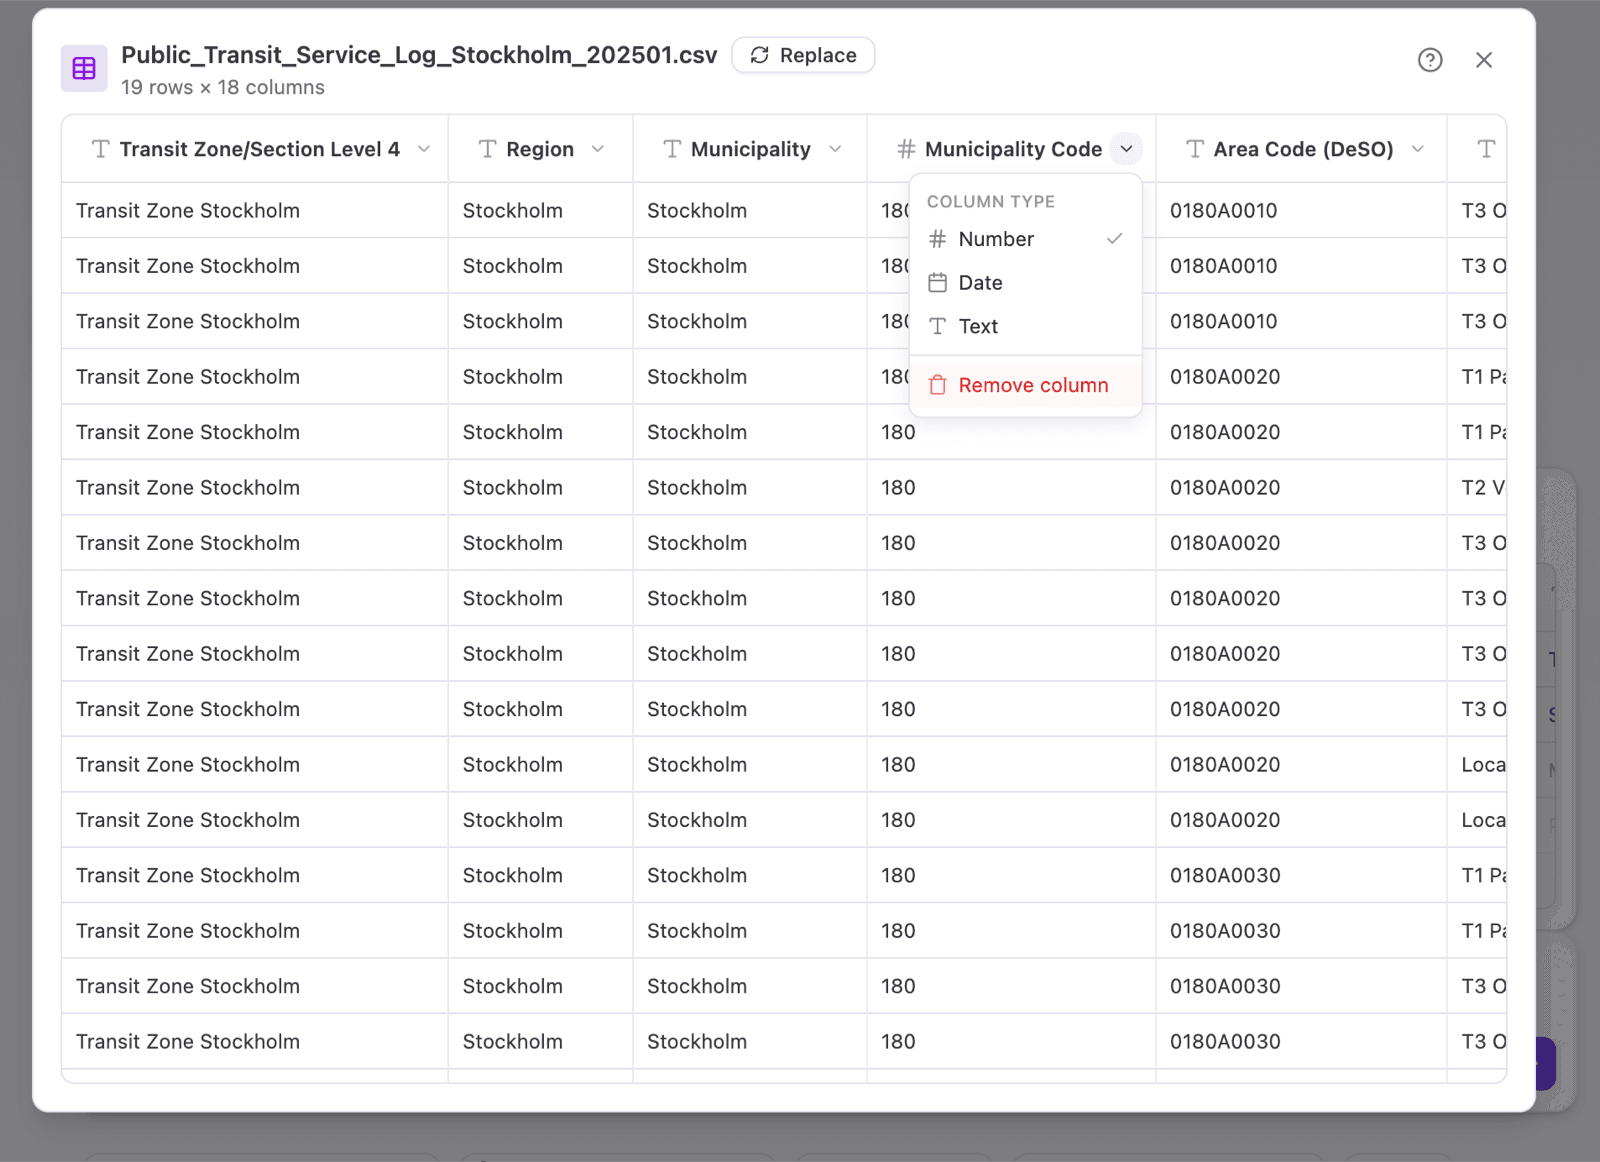
Remove columns
If you don’t need a column, or all the cells in that column are blank, open the column dropdown and choose Remove column.
When a warning appears
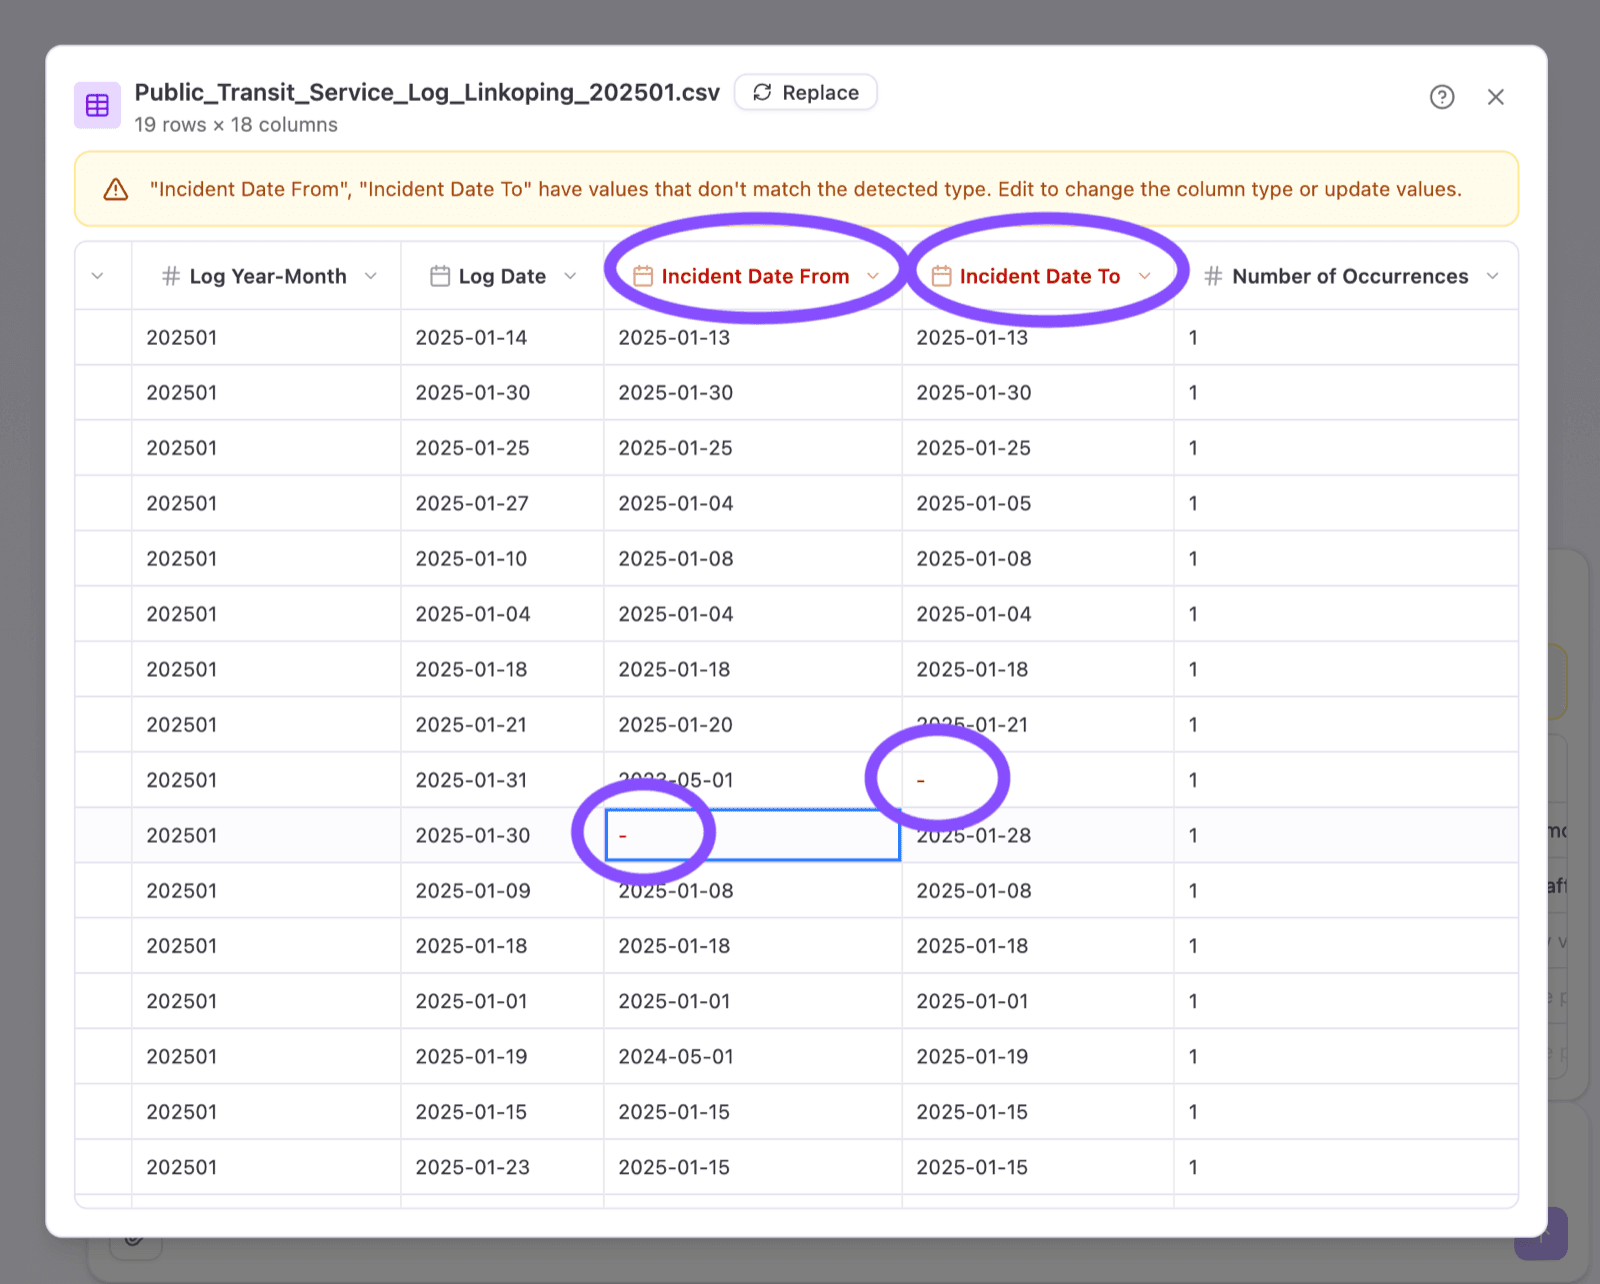
If you can’t move forward after uploading your data file, and you see a message that some values don’t match the column’s detected type, it means the column has entries that don’t fit. For example, a text value like “n/a” in a number column, or a date in an unexpected format, or “-” where dates are missing in a number column.
To fix it, open the data table with the edit (pencil) icon. The error message will tell you which columns to check, and the column headers and cells causing the warning will be highlighted in red in the data table. Now you need to do one of two things:
- Fix the values that don’t fit. Edit or remove the odd entries so the whole column is one type of data. Keep scrolling down to make sure you have addressed all the issues highlighted in red.
- Change the column type to match the data. If the problem is that the system set the column type wrong, you can manually change a column containing population counts to Number or a column of names to Text.
Once the data in the columns matches the correct type of data, the warning clears and you can continue to your chart.
Change a column’s type
Datastory detects whether each column is a number, date, or text. If it guesses wrong, or a warning flags a mismatch, click the arrow next to the column name and pick the correct type under column type. A checkmark shows the current column type. Changing a column’s type will change how the data is interpreted.
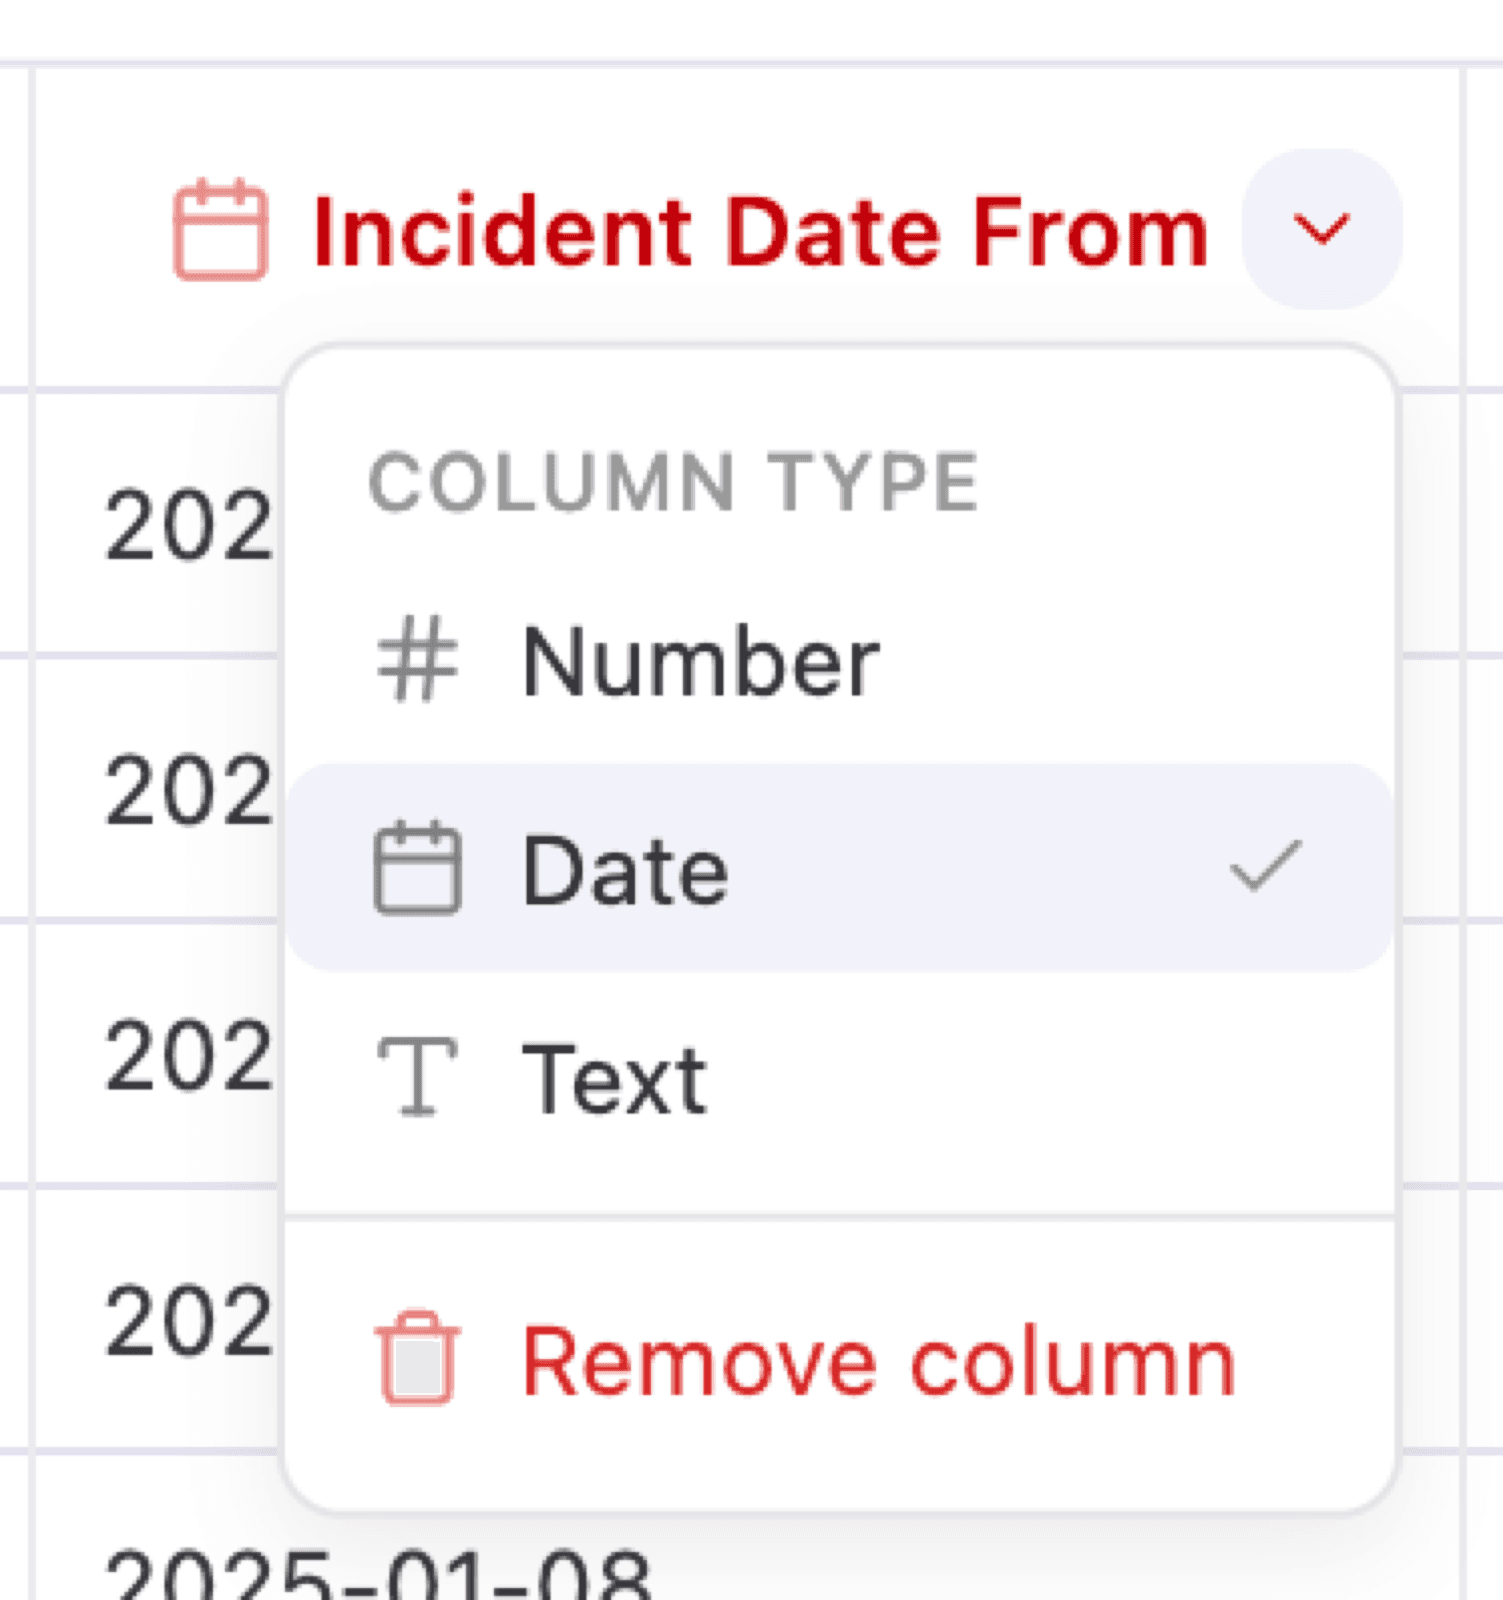
- Number for values you want to chart or calculate (amounts, percentages).
- Date for time values, so they plot correctly on a timeline.
- Text for labels and categories (names, codes, descriptions).
If a column of numbers is being read as Text, set its type to Number. If a date column is flagged, set it to Date and make sure every value uses the same format, since the system can’t read the column as dates if the patterns are mixed (for example, 2026-09-12 and 12/09/2026).
Edit your data in Studio
You don’t have to get everything perfect before creating your chart. The same data table is available in the editor, so you can edit values, rename headers, change column types, or remove columns any time while you’re customizing your chart.