
AI and insights
Insights grounded in real data
Ask in plain English. Get a grounded answer, cited to your data or Datastory's Open Data, with a chart to match. From "I wonder…" to a publishable insight in seconds.
Sign upPROMPT
What's the headline insight from EU renewable energy adoption?
“Renewables now meet 24% of EU energy demand, up from 8% in 2004. Eight EU members are above the 2030 target line.
Insight finder
The patterns you'd never spot alone.
Datastory AI scans your tables for spikes, regime changes, and correlations across thousands of rows, and then surfaces the ones that matter.
Anomaly detection across every numeric column
Trend changes, regime shifts, and inflection points
Cross-table correlations
One-click chart for every finding
PROMPT
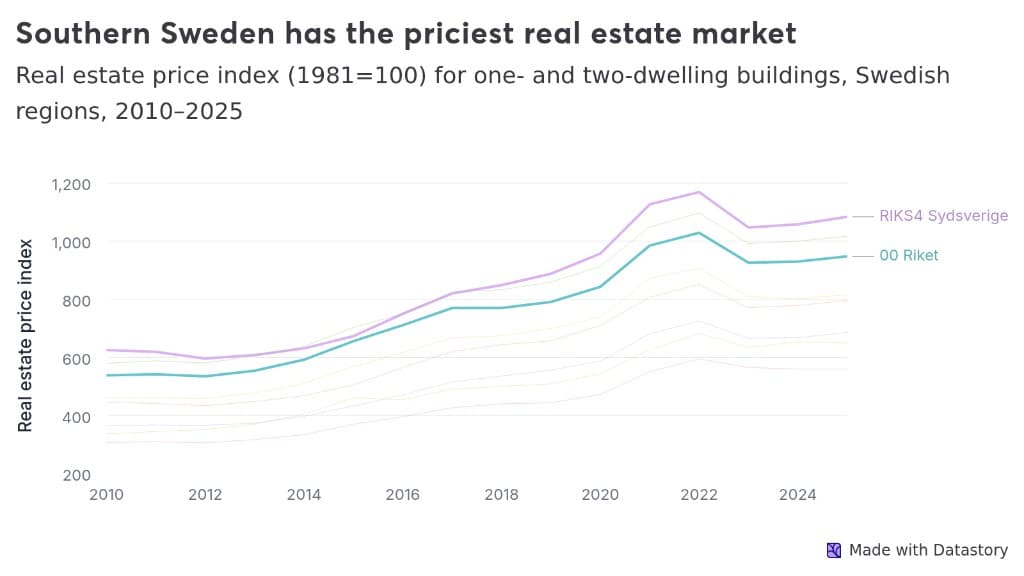
"Make a chart on Swedish housing prices, by region, since 2010"
STORY ALTERNATIVES

PUBLISHED STORY
Compose with AI
From a prompt to a published chart.
Describe what you want. Datastory AI drafts an outline, picks the right chart types, writes the captions and assembles the visualization. You edit, refine, and ship.
Story outline from a one-line prompt
Chart-type suggestions grounded in data shape
Stay in the driver's seat. Every output is editable.
Grounded in data
No hallucinations.
Just citations.
Every claim Datastory AI makes is traced back to a row in your data. If a source doesn't exist, the AI tells you. It doesn't invent one.
SOURCE TABLES
scb/housing.csv
eurostat/prices.csv
naturvardsverket.api
GROUNDED INSIGHT
Stockholm prices rose 4.2× faster than the national average between 2010 and 2024.
Out-of-bounds claims rejected. If no source supports it, Datastory AI says so and asks for more data instead of inventing one.
More platform features
Tools for storytellers
Each tool helps transform data into publishable stories, with support for structure, context, and clarity at every step.



Ready to transform your data into stories?
Join data journalists, researchers, and analysts creating compelling visualizations that inform, engage, and drive action.