

Features
The complete platform for data storytelling
Connect sources, build interactive charts, layer in AI, and publish data narratives anywhere without writing a line of code. One platform, end to end.
Join waitlist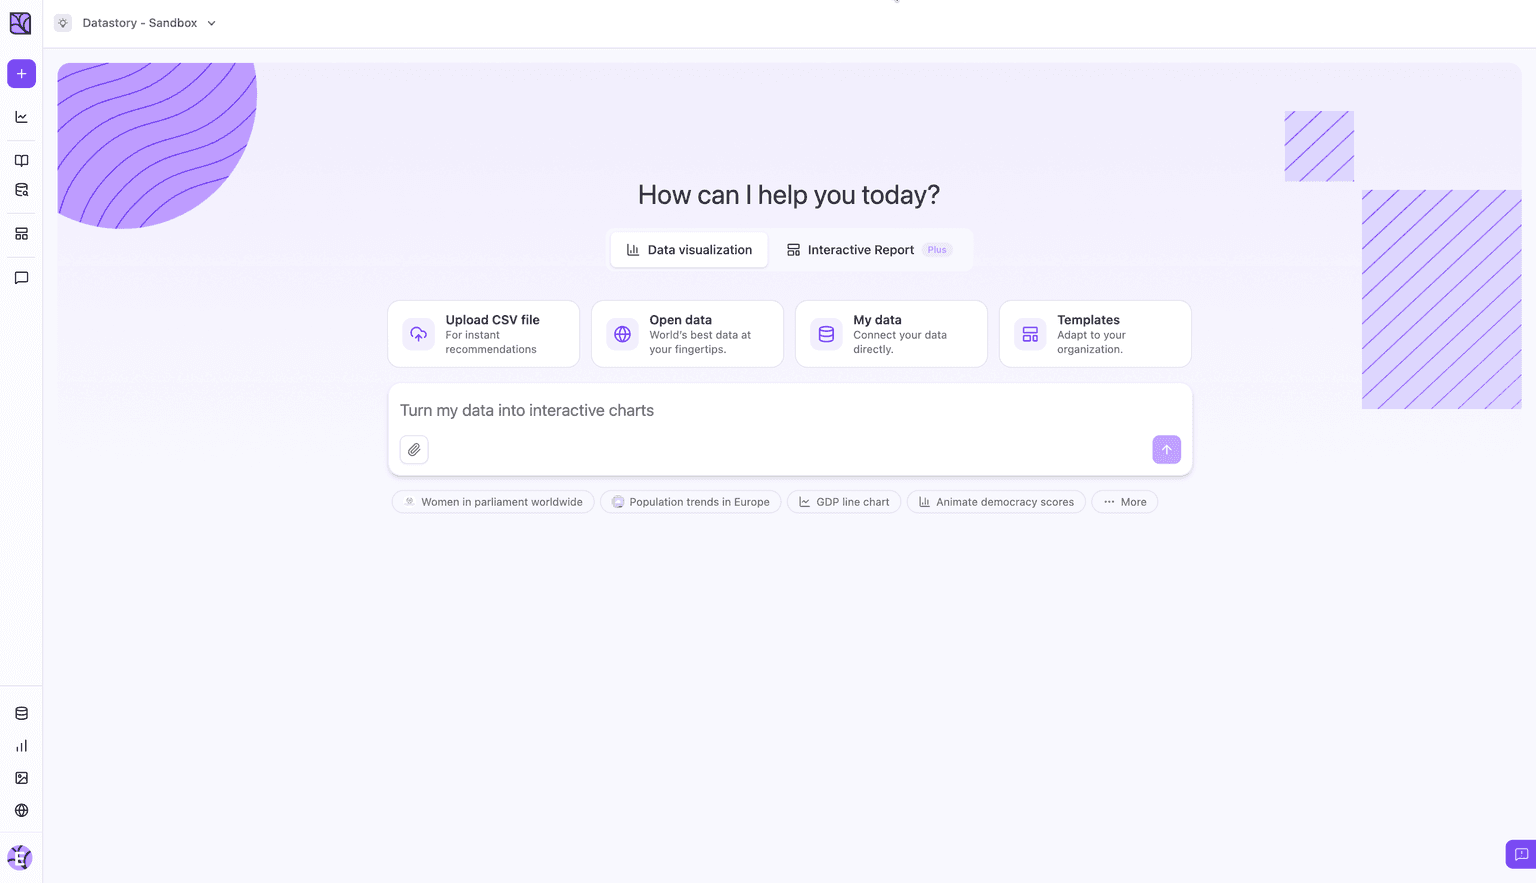
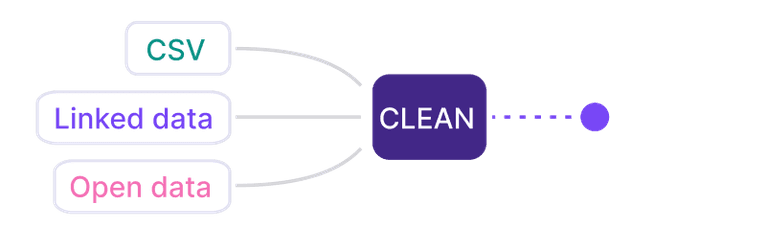
The Datastory workflow
Most tools stop at the visual. We don't.
Datastory is the only platform that takes you from raw, messy data all the way to a published narrative. Create charts that tell a story instead of just showing stats.
Stage 01
Connect data
Pull data from spreadsheets, your own linked data or quality metrics from our Open Data Catalog.
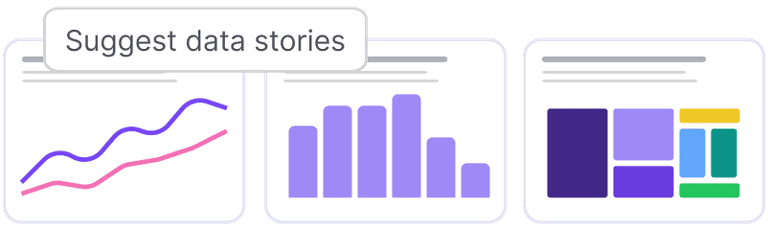
Stage 02
Shape your story
Collaborate with AI to identify the most interesting insights and the best way to visualize them.
Stage 03
Refine details
Edit captions, add annotations and tweak colors to make your story pop. Ask AI or tweak manually.

Stage 04
Publish
Publish as a standalone link, embed in websites or export as a high-quality image. Ready for any channel.

Data visualization
Production-ready charts out of the box
A diverse gallery of chart types with interactivity, accessibility and responsive design out of the box. Switch chart types without re-binding data.
Go from table to polished data visualization in minutes.
Pick a table, pick a chart, ship it. Or start from one of our editorial templates and tweak. Every chart is responsive, accessible, and embeds anywhere.
Smart chart recommendations from your data shape
Inline annotations, sources, and methodology
Built in responsiveness
Customize to your brand or pick from journalism presets
platform.datastory.tech/visualizations/gdp-per-capita
Rich chart gallery
Bars, lines, areas, beeswarms, slopes, treemaps, scatter plot and more. Every common data visualization, ready to use.
Smart recommendations
The chart picker looks at your columns and proposes the right encoding: categorical, temporal, geographic, or hierarchical.
Anywhere embed
Drop a chart into Notion, Webflow, a newsletter, or a CMS. Responsive iframe with shareable URLs and OG previews baked in.
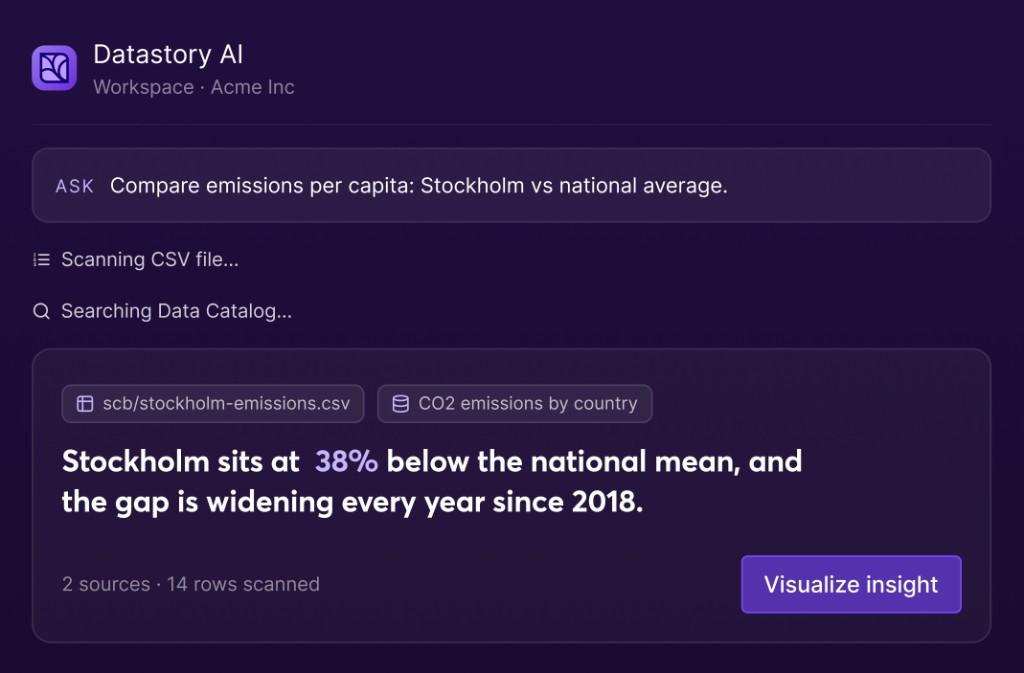
AI & insights
AI that actually understands your data.
Ask AI to recommend interesting angles or come with specific question and get an answer grounded in your tables, with a chart to match.
From "I wonder…" to a publishable insight in seconds.
Datastory AI ships with your CSV file, linked data or Datastory's Open Data Catalog as context. It reads your tables, understands your dimensions, picks the right chart and writes the caption with sources attached. You stay in the driver's seat.
Uncover new insights or dig deeper into an area of interest
Auto-captions with editable drafts
Grounded in your data, never a hallucinated stat
Chart-type suggestions from data shape
Compose with AI
Build whole stories from a prompt: "visualize Swedish housing prices, by region, since 2010".
Insight finder
Surface anomalies, trend changes, and correlations across thousands of rows in seconds.
No data hallucinations
AI can only provide insights that are grounded in data that exists in your workspace.
Linked data
Linked data that unlocks powerful connections
Unify datasets from different sources, formats, and schemas into a coherent knowledge graph. Let AI find connections you never knew existed.
Turn data chaos into connected knowledge
Stop managing disconnected datasets. Create a unified knowledge graph that reveals hidden insights and maintains consistency across all projects.
Surface hidden connections by finding datasets that join on common dimensions
Built-in semantic types such as places, time, currency, percentages to easily build your schema
Augment your linked data with one-off spreadsheets when you need it, or enrich your data with global trends using Datastory's Open Data Catalog
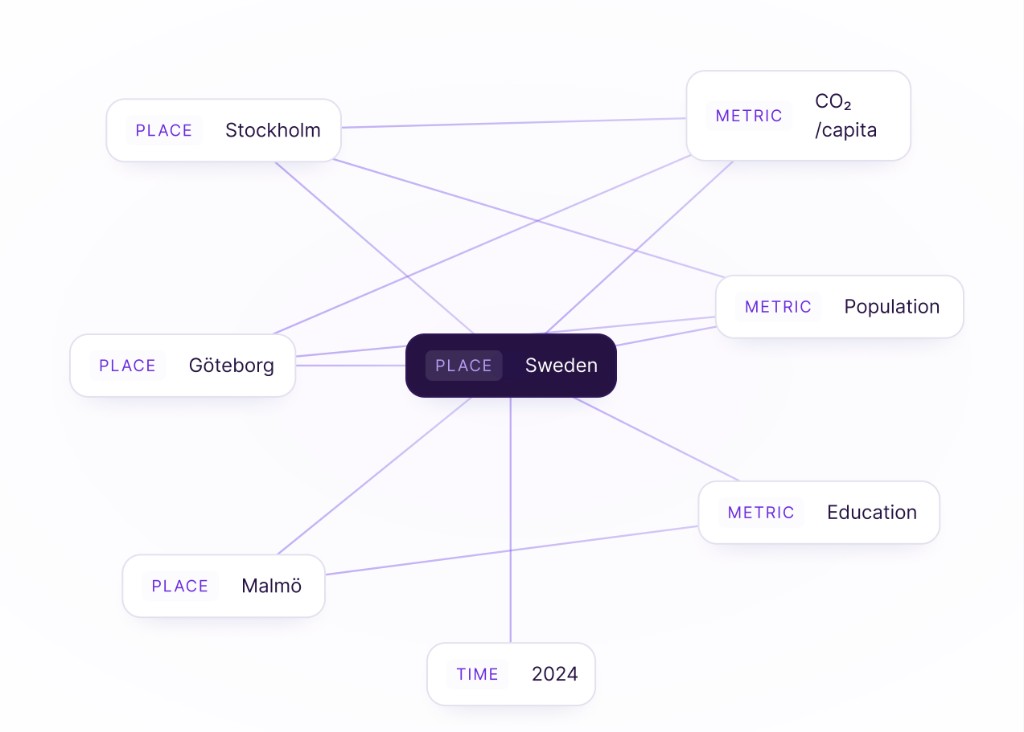
Reusable metrics
Define a metric once, such as "CO₂ per capita, tons/year", and reuse it across every story in your workspace.
Semantic understanding
AI understands data relationships and suggests insights based on real connections.
Simple schema builder
Build powerful knowledge graphs visually, with no coding required.
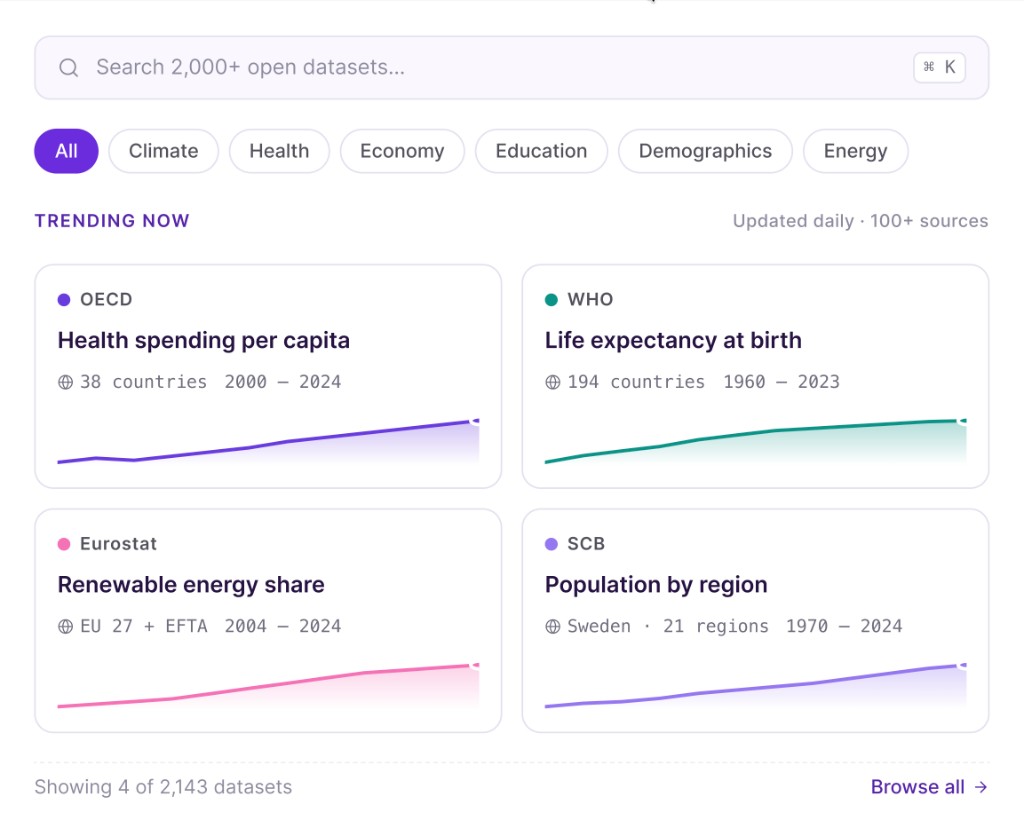
Open data
Visualize statistics from quality data sources
Find, explain and visualize statistics through our Open Data catalog. Browse datasets from 100+ vetted data sources such as the OECD, WHO and Eurostat.
The world's best data at your fingertips
Quickly find reliable data for your project or enrich your organization's data through adding a global perspective to nuance local or industry-specific data.
Endless possibilities to visualize and explain
Powerful browsing by topic, source or trending to find what you need
100+ sources with data on a wide set of topics
Filter on your country to easily find data that your country has reported on
Combine with own data
Supercharge your analysis by connecting your data with our open data sources. Access data on a wide range of topics to tell a complete story.
AI-powered insights
Let AI reveal hidden patterns, unexpected correlations, and key drivers within your datasets, turning raw information into actionable intelligence.
Powerful browsing
Explore a wide range of topics, trusted sources, or the latest trending content to easily find exactly what you're looking for.
Ready to transform your data into stories?
Join data journalists, researchers, and analysts creating compelling visualizations that inform, engage, and drive action.