

Global State of Democracy 2025
International IDEA's Global State of Democracy 2025 report became an interactive, web-native publication with charts readers can explore.
About
- Client
- International Institute for Democracy and Electoral Assistance (IDEA)
- Solution
- Interactive report
- Sector
- Public sector
The challenge
International IDEA's Global State of Democracy report assesses democratic performance in 173 countries. Its findings are carried by dozens of figures and detailed country data, and IDEA wanted all of it to be as easy to read and explore on the web as in print.
Value delivered
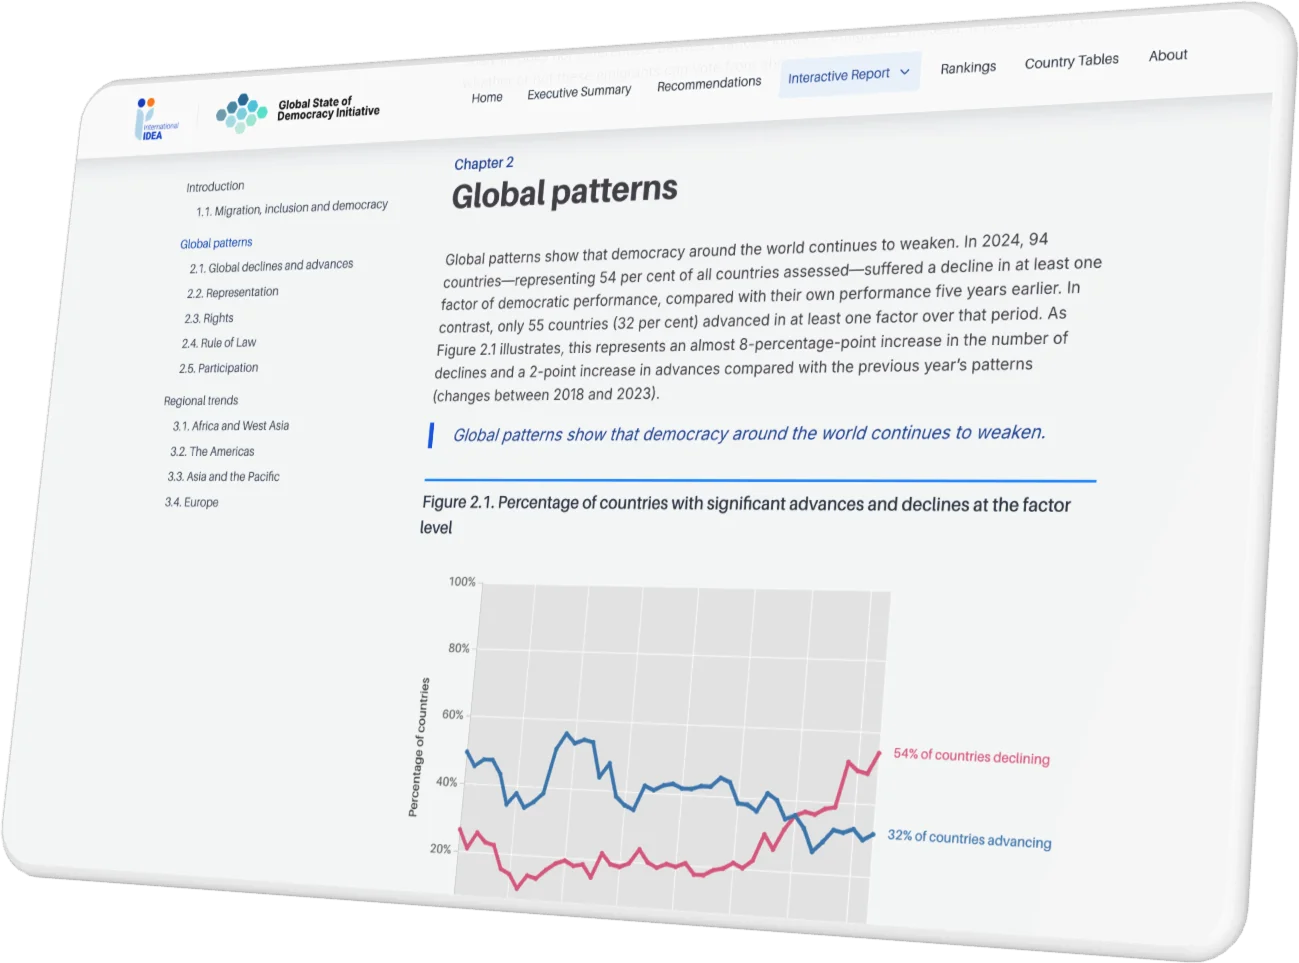
The interactive report presents The Global State of Democracy 2025 on the web chapter by chapter, with 32 interactive figures, country rankings and country tables that readers can explore and link to.
Background
International IDEA is an intergovernmental organization with 35 member states, founded in 1995 to support sustainable democracy worldwide. Its Global State of Democracy Indices assess democratic performance in four categories: Representation, Rights, Rule of Law and Participation.
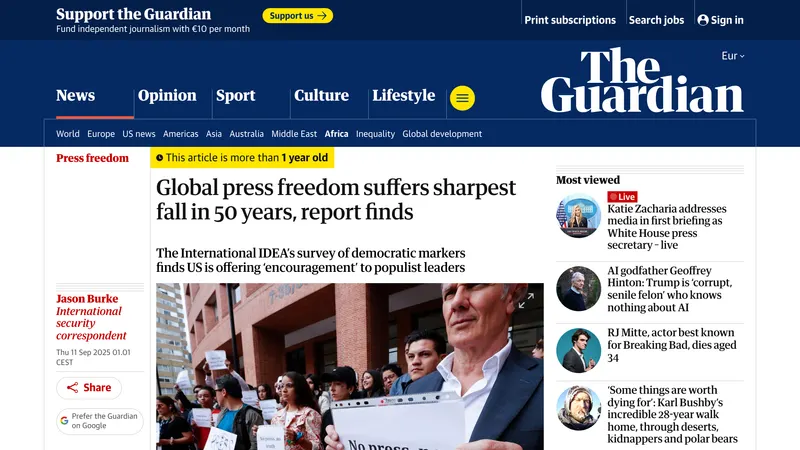
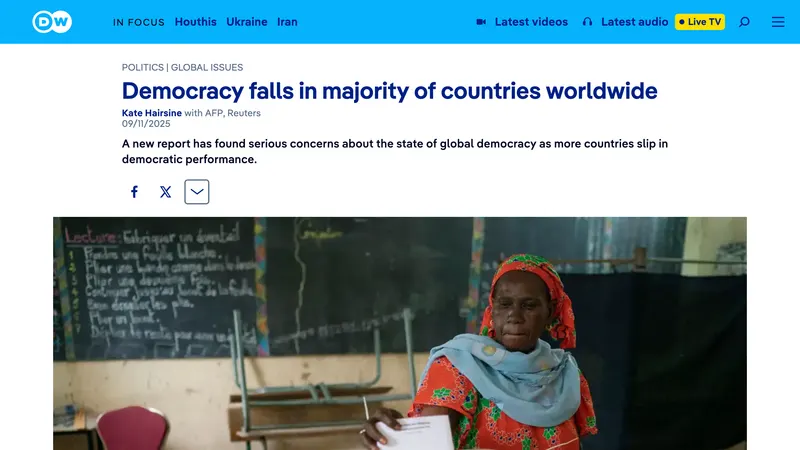
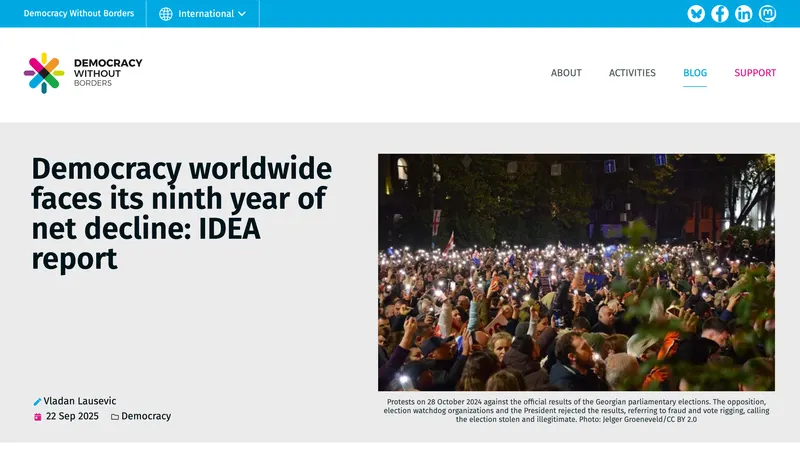
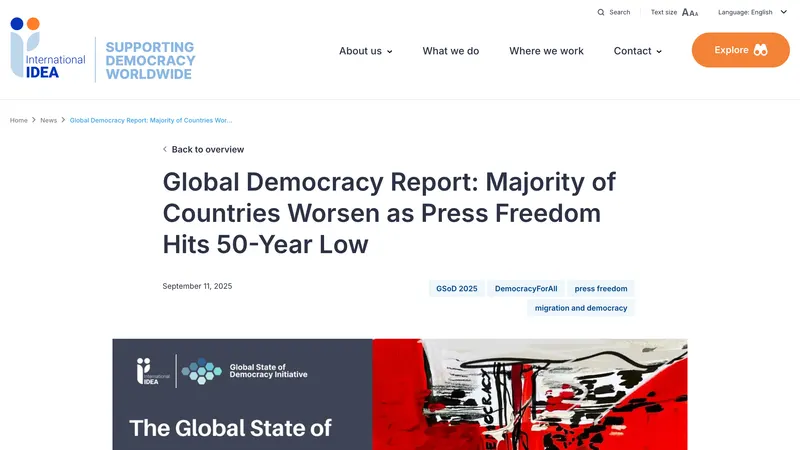
The 2025 report, Democracy on the Move, was published on 11 September 2025. It found that 2024 was the ninth consecutive year in which more countries declined than improved, and that press freedom suffered its most far-reaching fall in 50 years. Its second part explores migration and voting rights for citizens living abroad.
Solution
Datastory built the report as a web-native publication, not just a PDF to download. The figures sit next to the text they support, so the analysis and the evidence are read together.
A page for every section
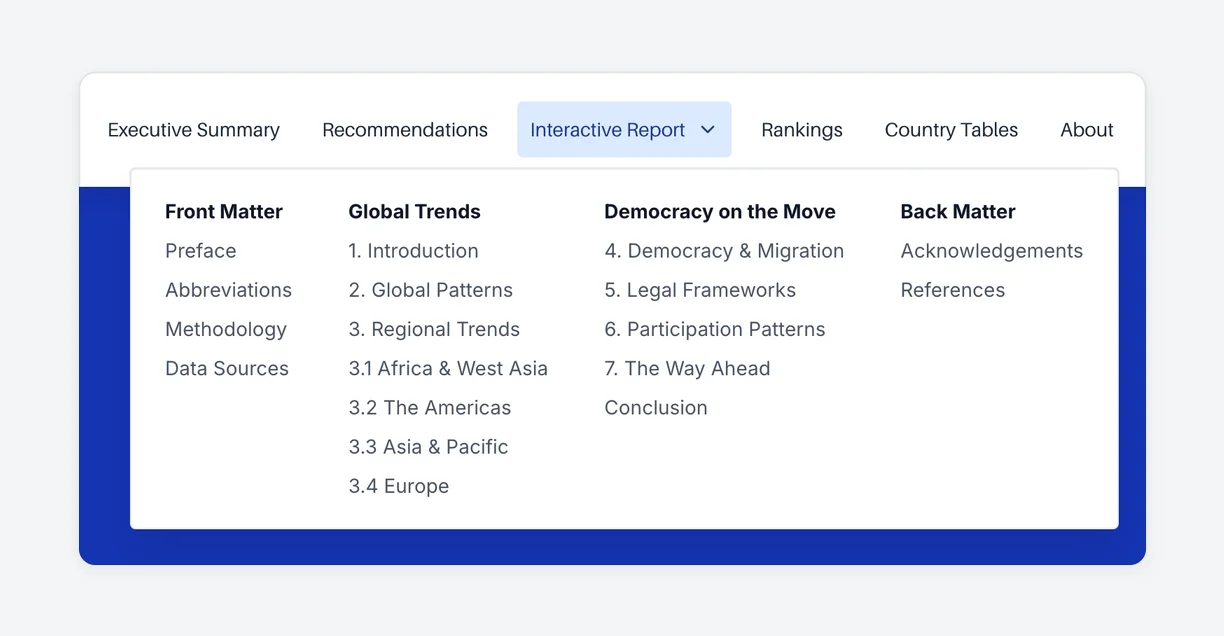
Every section of the report has its own page, from the executive summary and the recommendations to Part 1 on global trends, Part 2 on democracy on the move, and the rankings and country tables in the annexes. The site header links to all of them from every page, and its Interactive Report menu lists the chapters of each part, so readers can go straight to a chapter such as the regional trends for Europe.
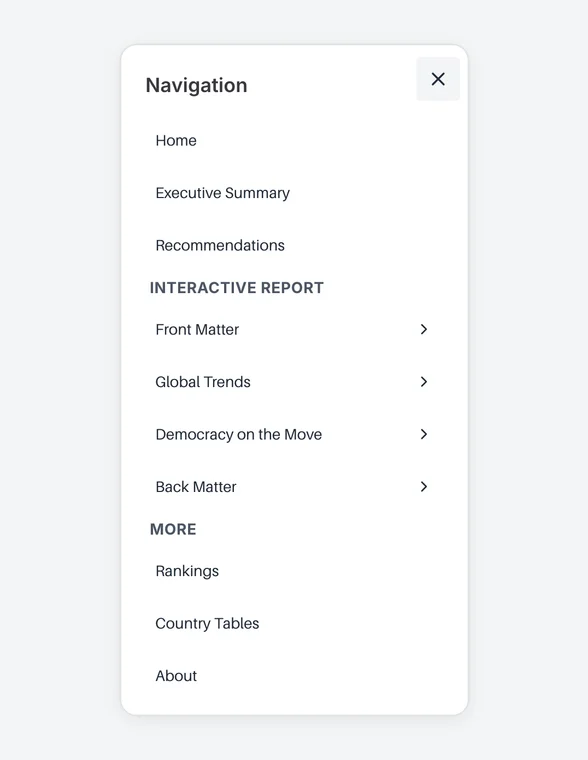
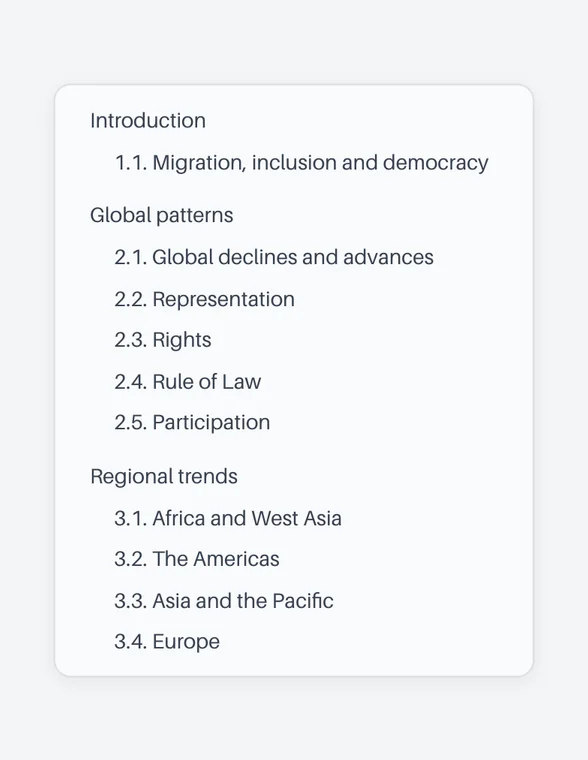
The header stays at the top as the reader scrolls, and on each part's page a table of contents follows along beside the text. On smaller screens, the same sections open from a menu.
Interactive figures
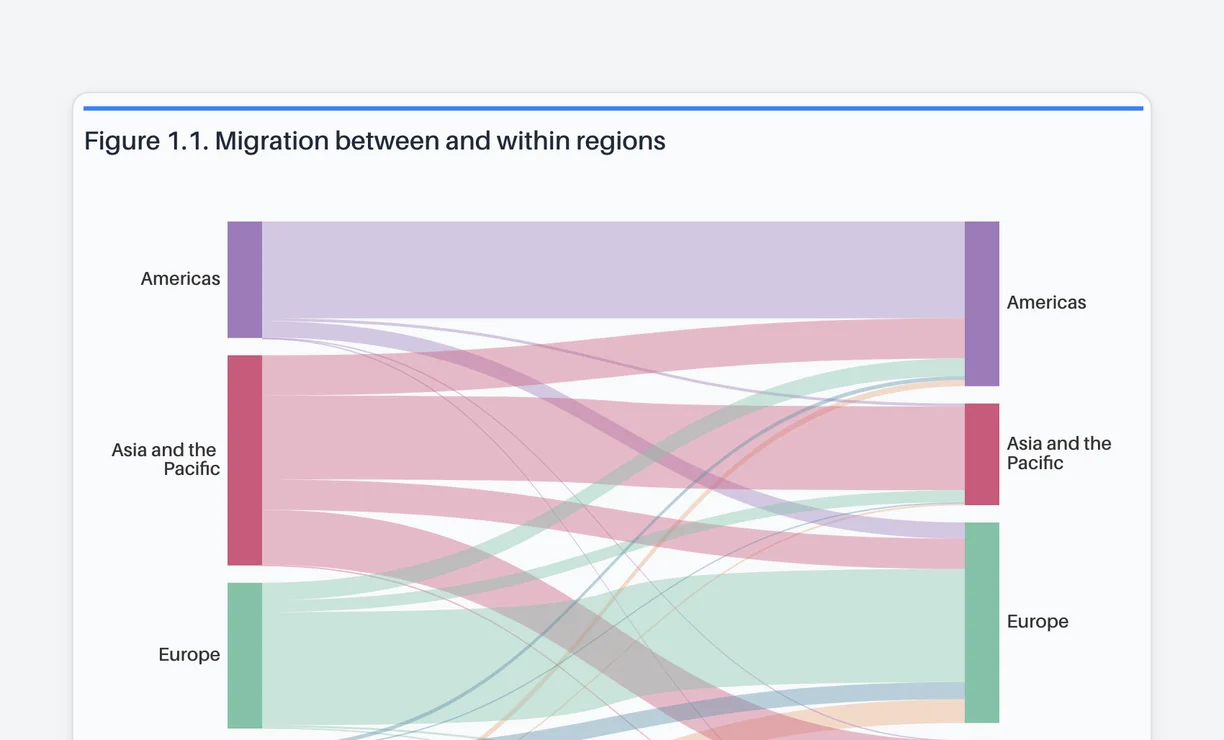
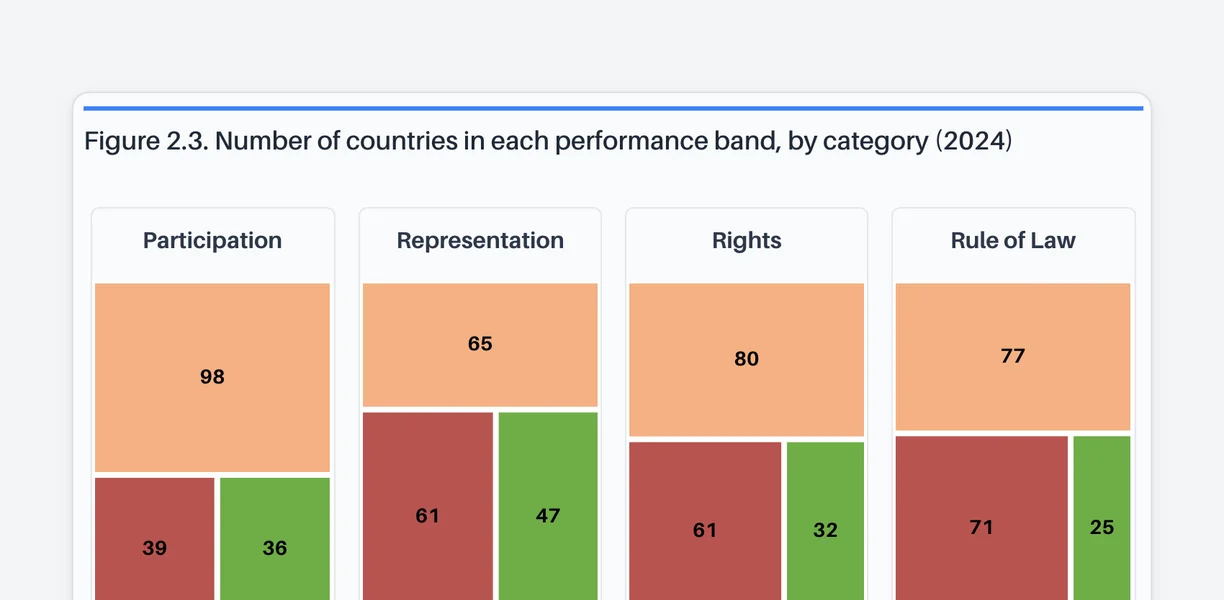
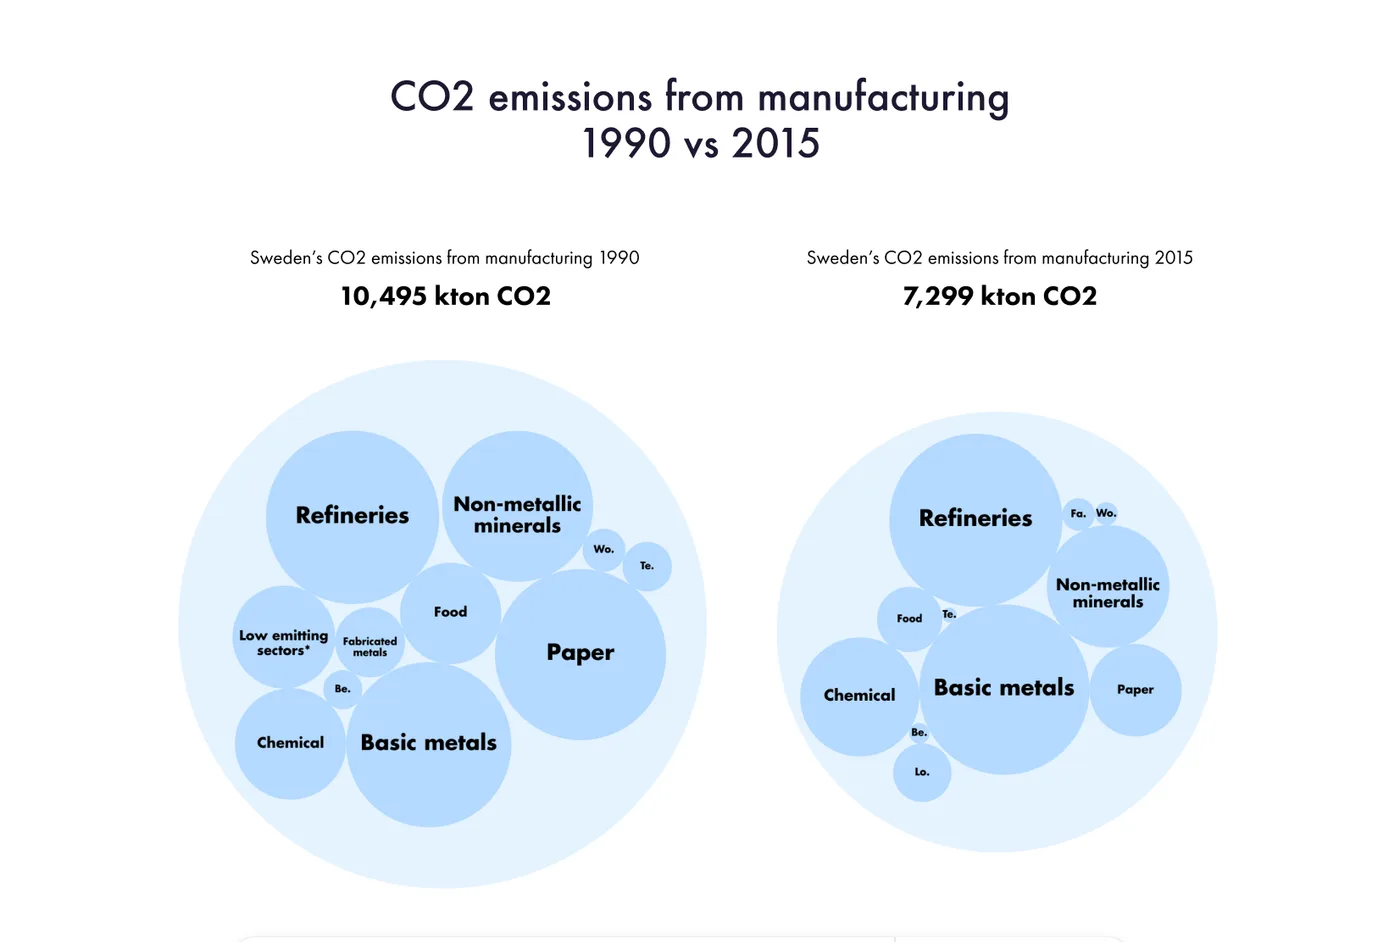
All 32 figures in the report are interactive charts, from Sankey diagrams of migration flows to bar charts by region, treemaps, radar and scatter charts. Readers can hover for exact values instead of reading them off a static image.
Rankings and country tables
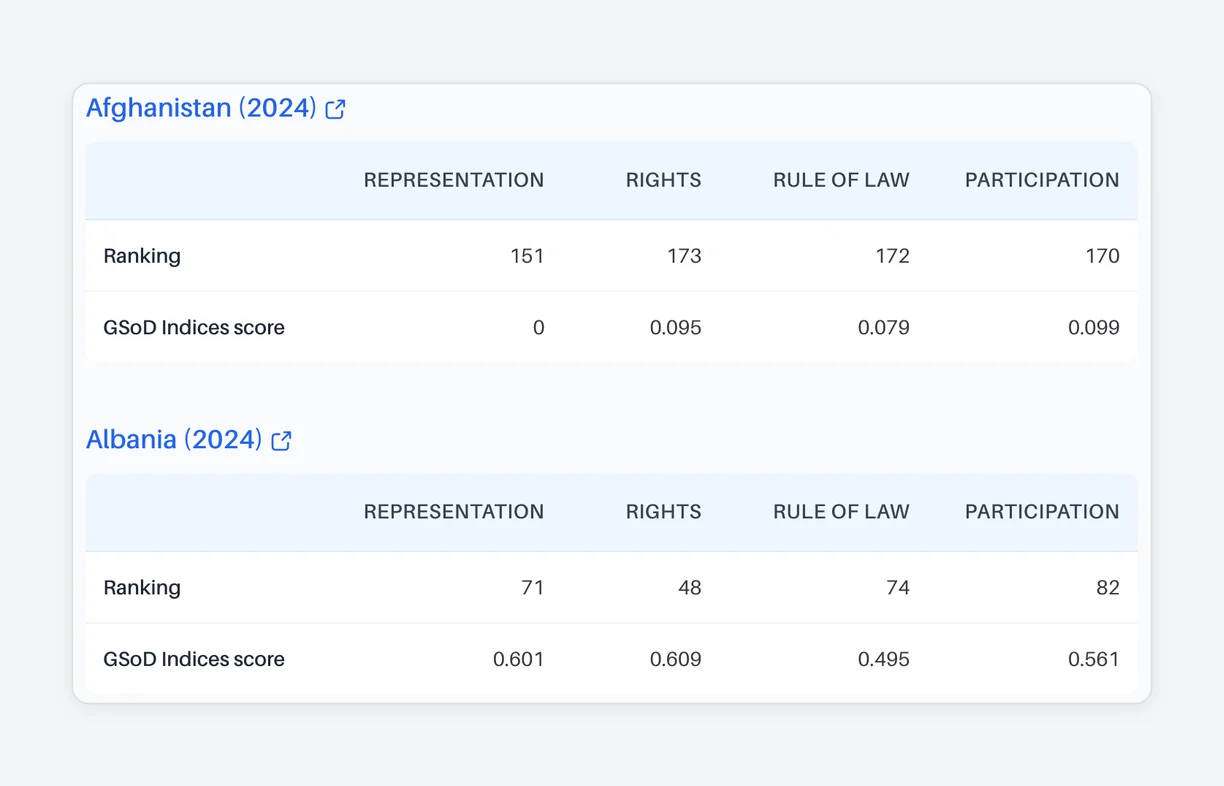
The annexes rank every country in each of the four categories and list its scores, with the uncertainty around each estimate shown as a range of possible rankings.
Technology
Charts from the report's data
The figures are drawn from the same CSV data that sits behind the report, using a shared set of chart components for bar, line, radar, Sankey, scatter, stacked bar and treemap charts.
Built for reading on the web
Every page and chapter has its own address, so any part of the report can be linked to directly. The full report is still available as a PDF from the front page.
Results
“This is one of the most beautiful ways of showing the Global State of Democracy findings that I have ever seen. It was a pleasure to work with Datastory, who went above and beyond to create this site for us.”
 Seema ShahHead of Democracy Assessment, International IDEA
The interactive report gives The Global State of Democracy 2025 a home on the web, where its findings can be read, explored and shared chapter by chapter.
Readers can go straight from a headline finding, such as the decline in press freedom, to the figures and country data behind it.
Publicity

Need to turn a report into an interactive experience?
Tell us what you want to publish, and we’ll show you how we’d build it.