

Vården i siffror
Vården i siffror is an initiative by Sveriges Kommuner och Regioner (SKR) and functions as the data hub for Swedish healthcare data. We built a new version of the site that makes data more accessible and actionable.
About
- Healthcare indicators
- 1200+
- Data sources
- 100+
- Data-driven pages
- 1800+
- Client
- Sveriges Kommuner och Regioner (SKR)
- Solution
- Data hub
- Sector
- Public sector
- Built as
- Custom project
The challenge
Sweden's regions publish a wealth of data on the quality and efficiency of healthcare, drawn from more than 100 data sources. Making around 1,200 indicators easy to find, compare and act on, for people with very different needs, is a challenge in itself.
Value delivered
The new Vården i siffror makes it easier to find, explore and follow developments in healthcare. Data can be explored by region, municipality, theme, condition and national program area, with a modern chart tool and better export.
Background
What is Vården i siffror?
Vården i siffror is the regions' shared platform for continuous publication of data on healthcare quality and efficiency. It is part of the national system for knowledge-based management in healthcare, run by the regions together and administered by SKR, the Swedish Association of Local Authorities and Regions.
Who is the target audience?
Its primary audience is people who work with the management, governance and planning of healthcare at different levels. An editorial team at SKR decides which indicators to show, in dialogue with each data source.
Datastory's role
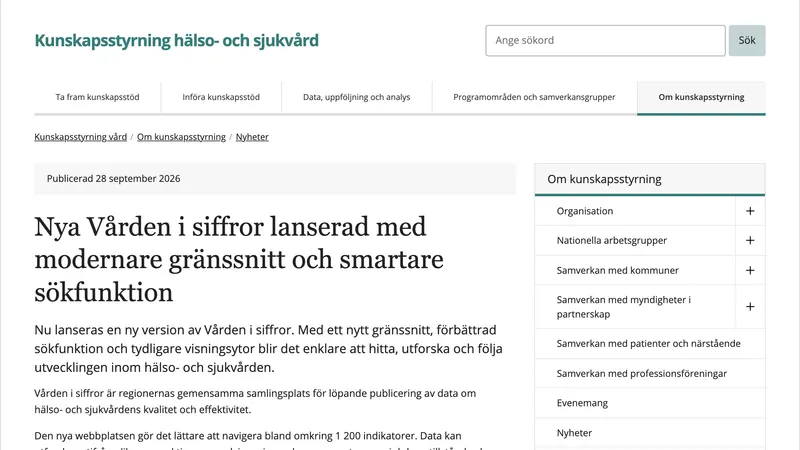
Datastory carries out the technical development and maintenance of Vården i siffror on behalf of SKR. The new version, launched on 28 September 2026, is the result of a comprehensive redevelopment focused on usability and on adapting the site to its different audiences.
Solution
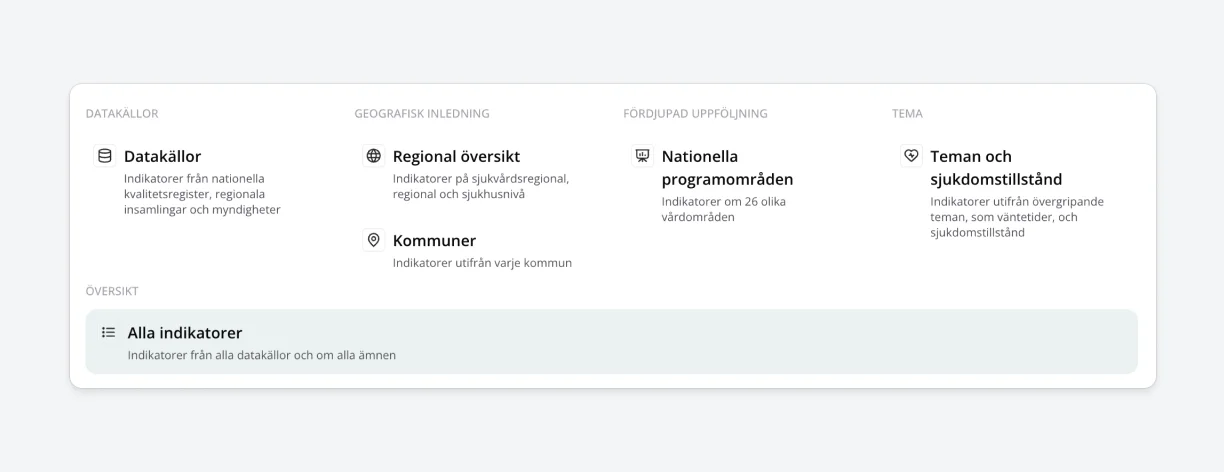
The new site organizes the indicators into views tailored to their audience. Users can see the data relevant to one unit, such as a healthcare region, region, hospital or municipality, or to one group of indicators, by data source, condition or theme.
New pages for each of the 26 national program areas, which lead knowledge-based management in their fields, gather the indicators relevant to each area, to strengthen follow-up and analysis. An improved indicator page gives more context, and an improved export makes it possible to fetch larger amounts of data through an API.
Better curation and grouping of data
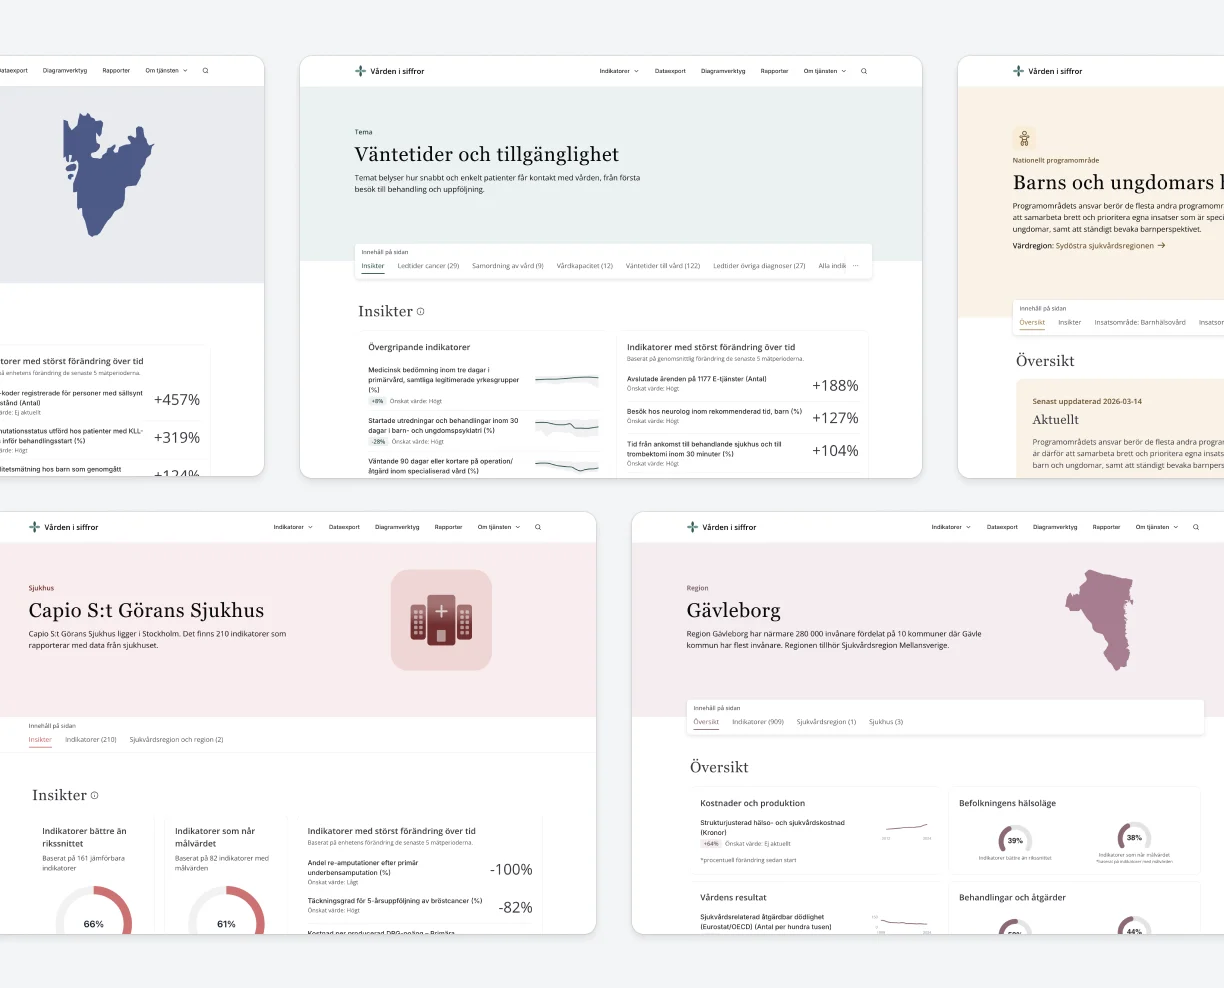
Instead of having to find relevant data from a long list of indicators, the new site offers various profile pages with relevant slices of data. Every region, hospital and municipality has its own page with the indicators it reports on, as do themes, disease conditions, data sources and national program areas.
Dedicated data explorer tool
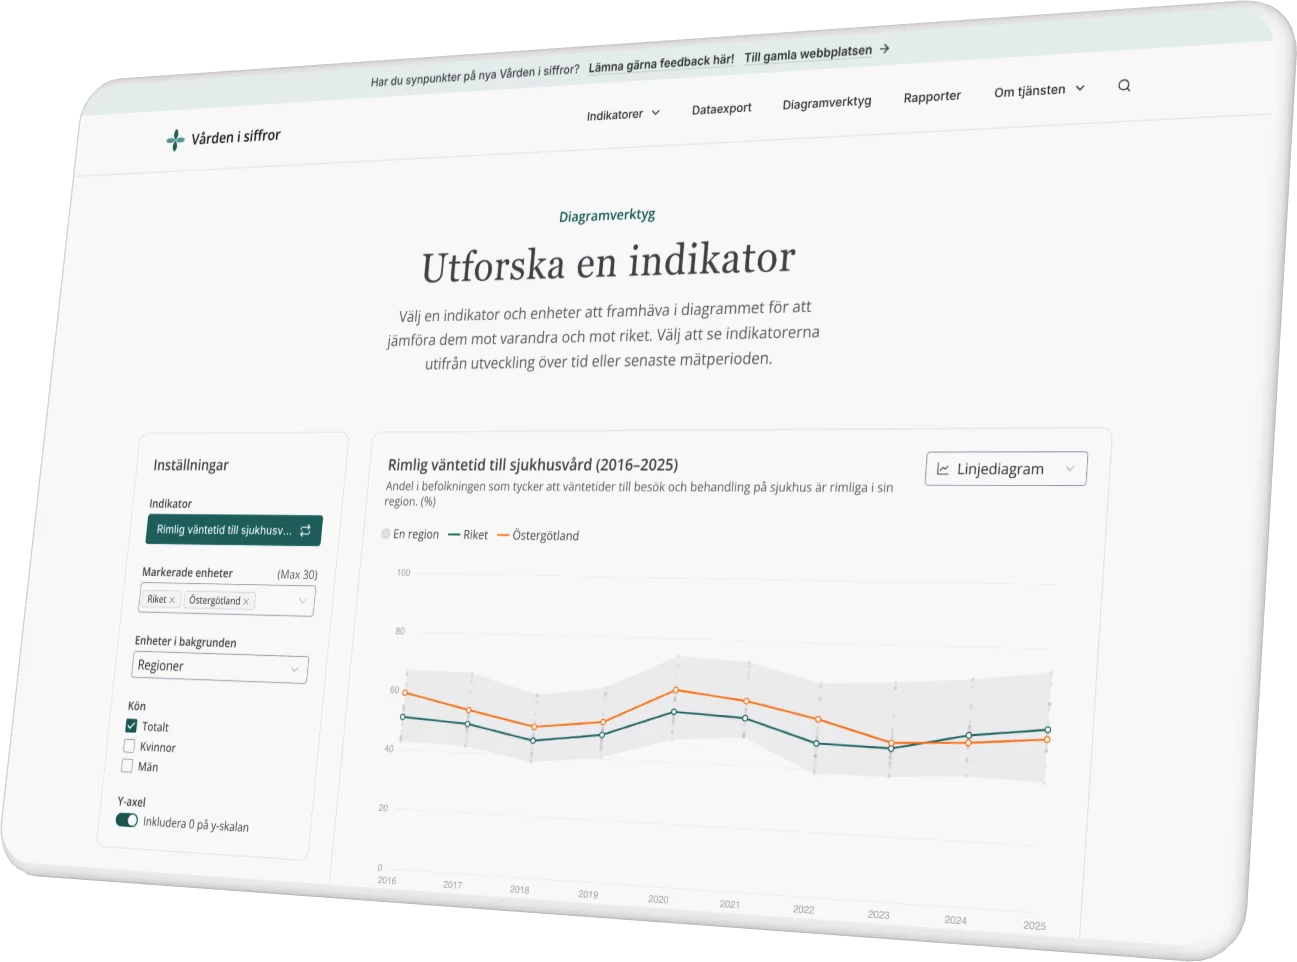
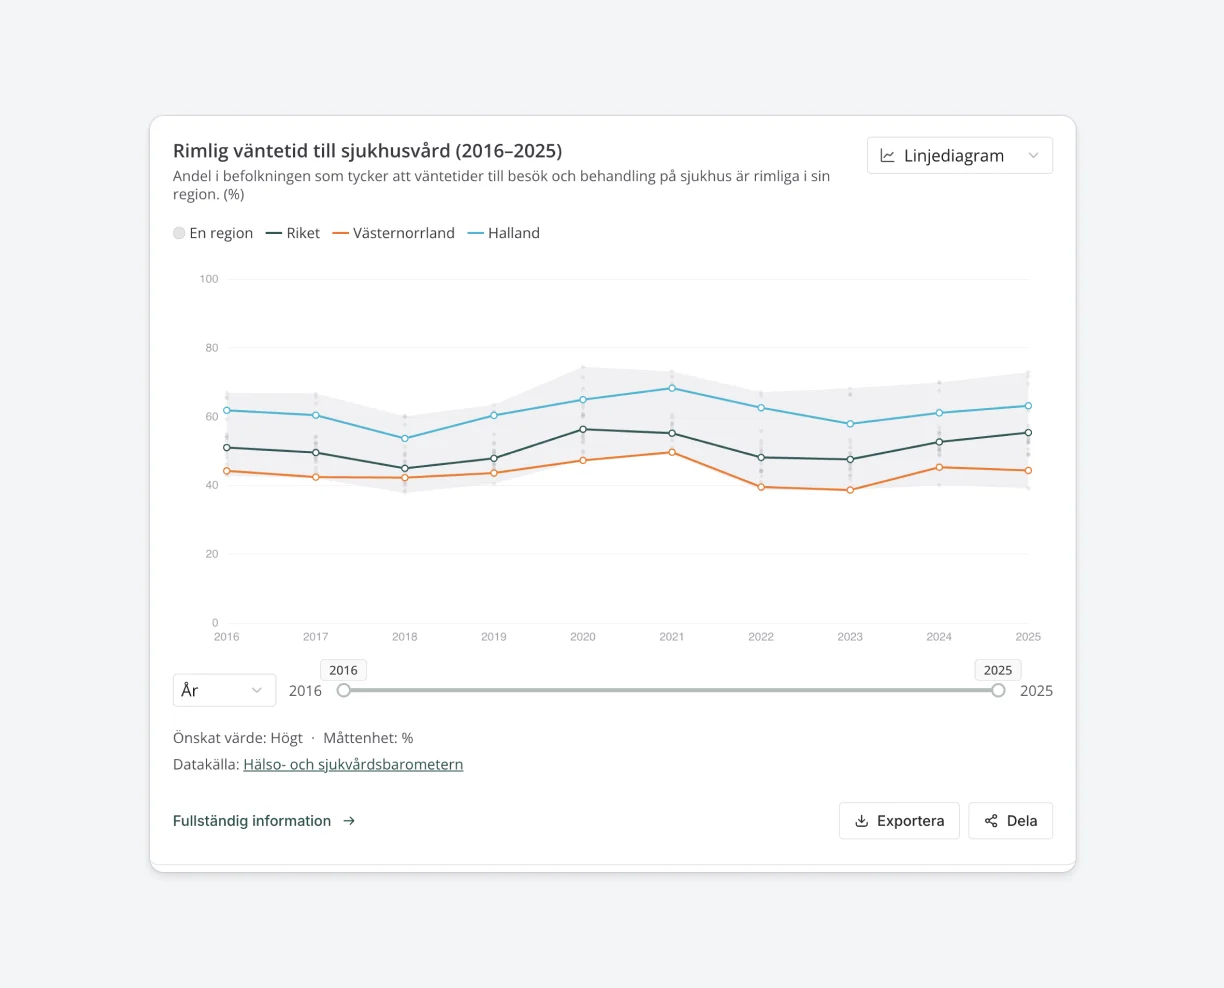
The old site mixed static charts and interactive controls on the same page, which confused visitors. Now each page has one job. Profile pages present a ready-made selection of charts and lists. Diagramverktyget is for exploring: pick any indicator and choose which regions or hospitals to compare.
Enhanced search functionality
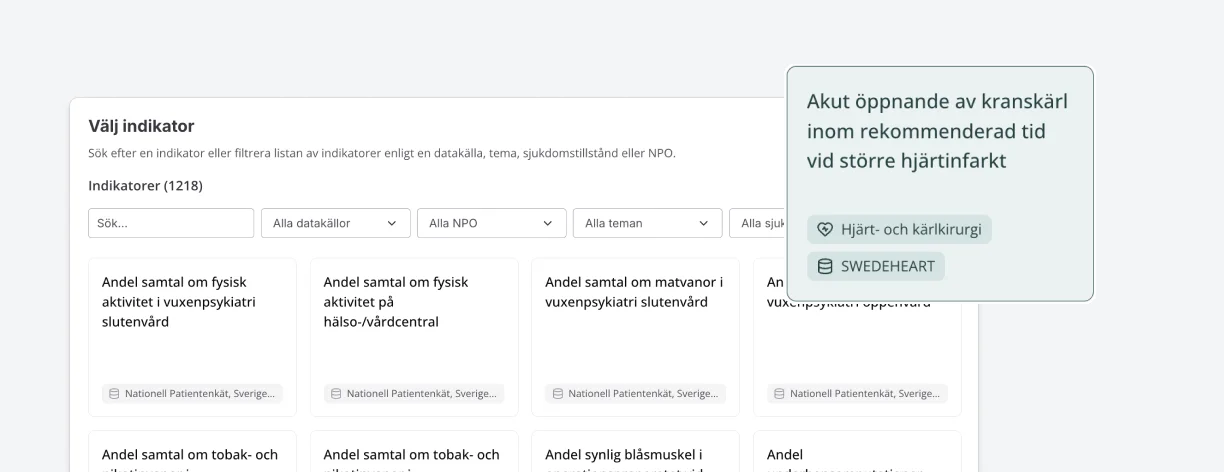
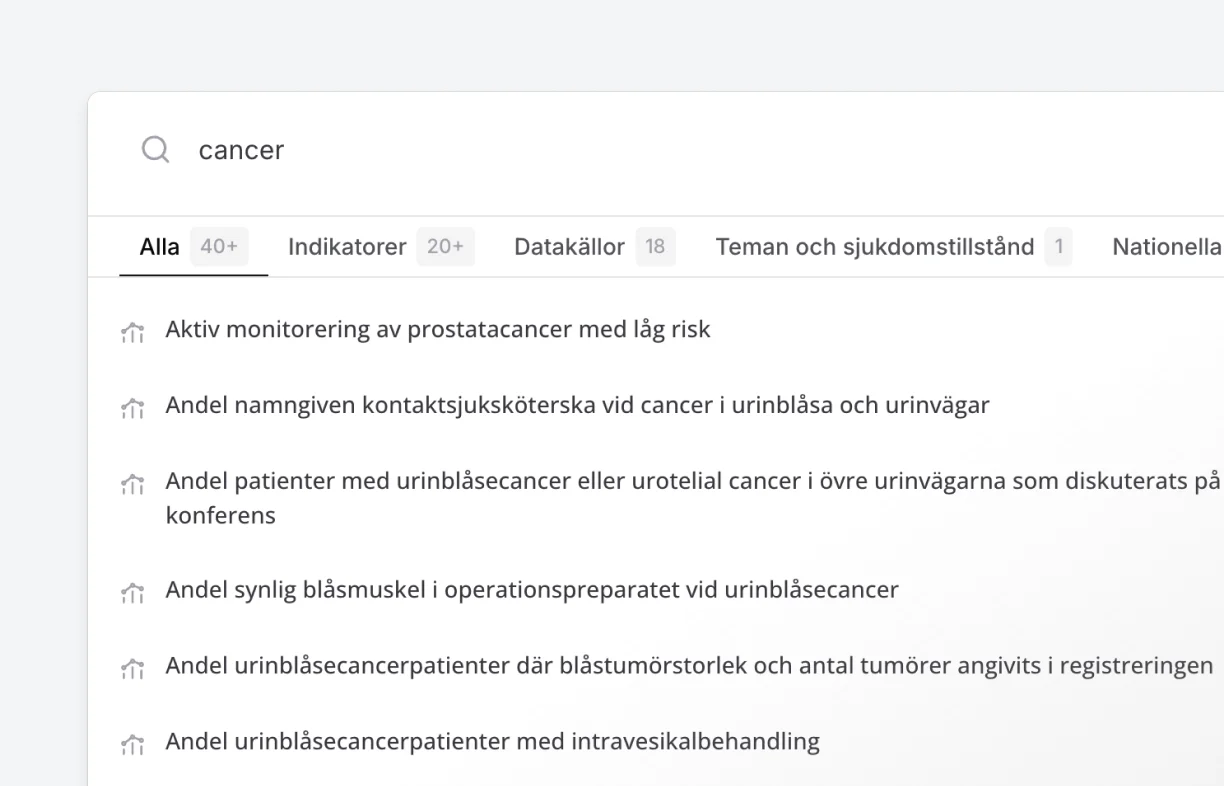
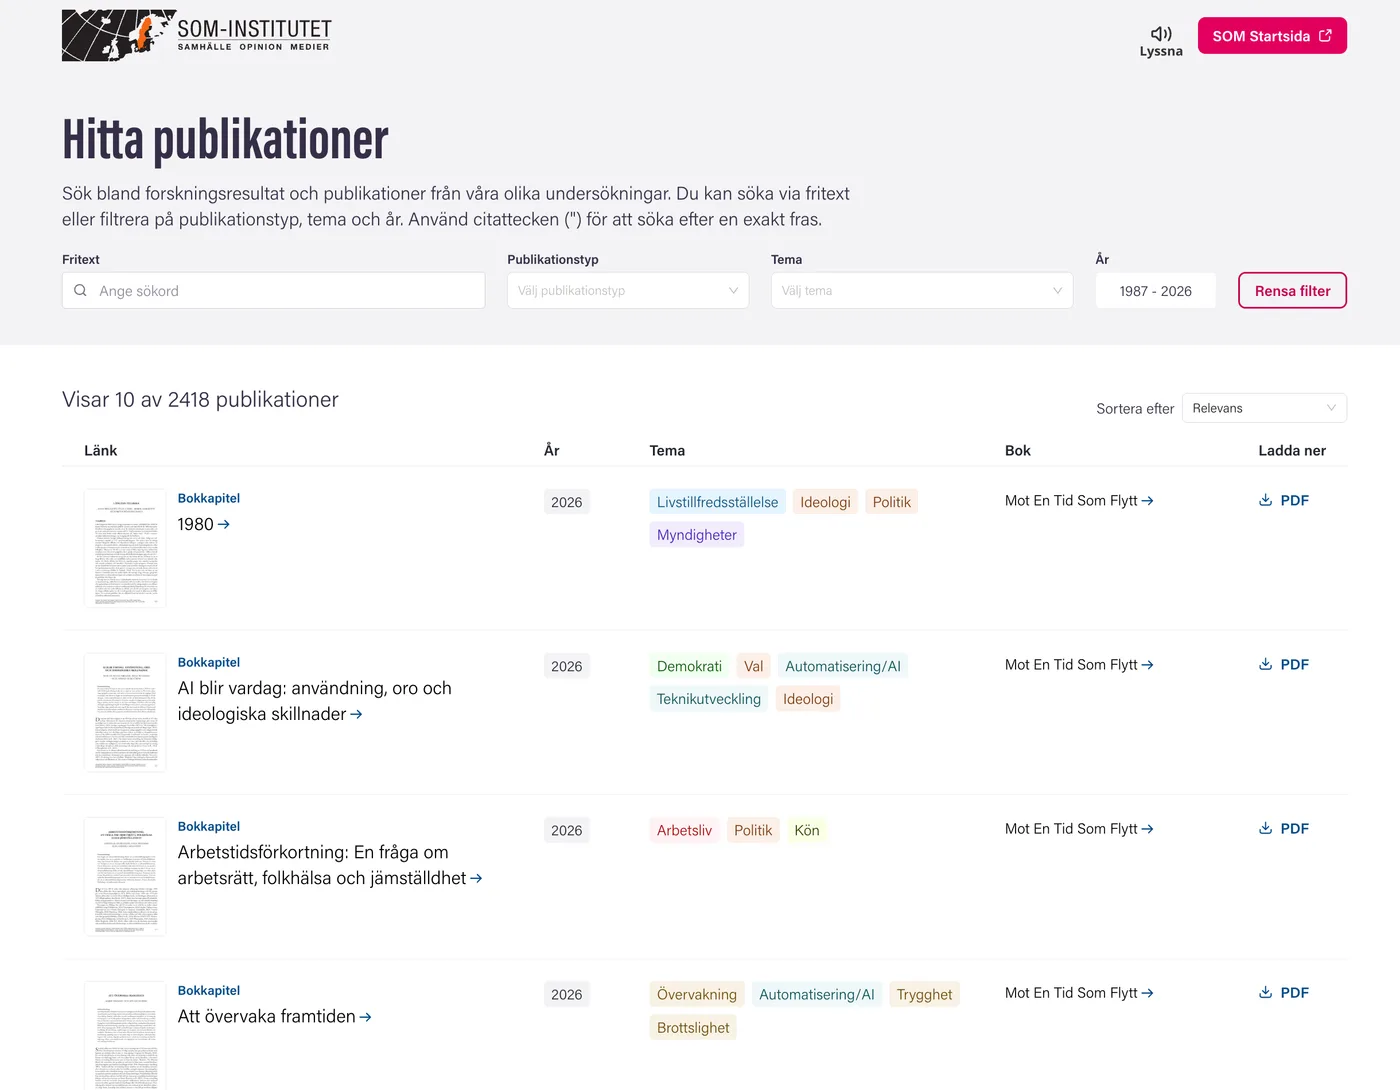
The old search only covered indicator names. The new search finds every type of content: indicators, data sources, themes, regions, hospitals, municipalities and more. Tabs group the results by type, so a search for “cancer” can be narrowed to data sources with a single click.
Automatic insights on profile pages
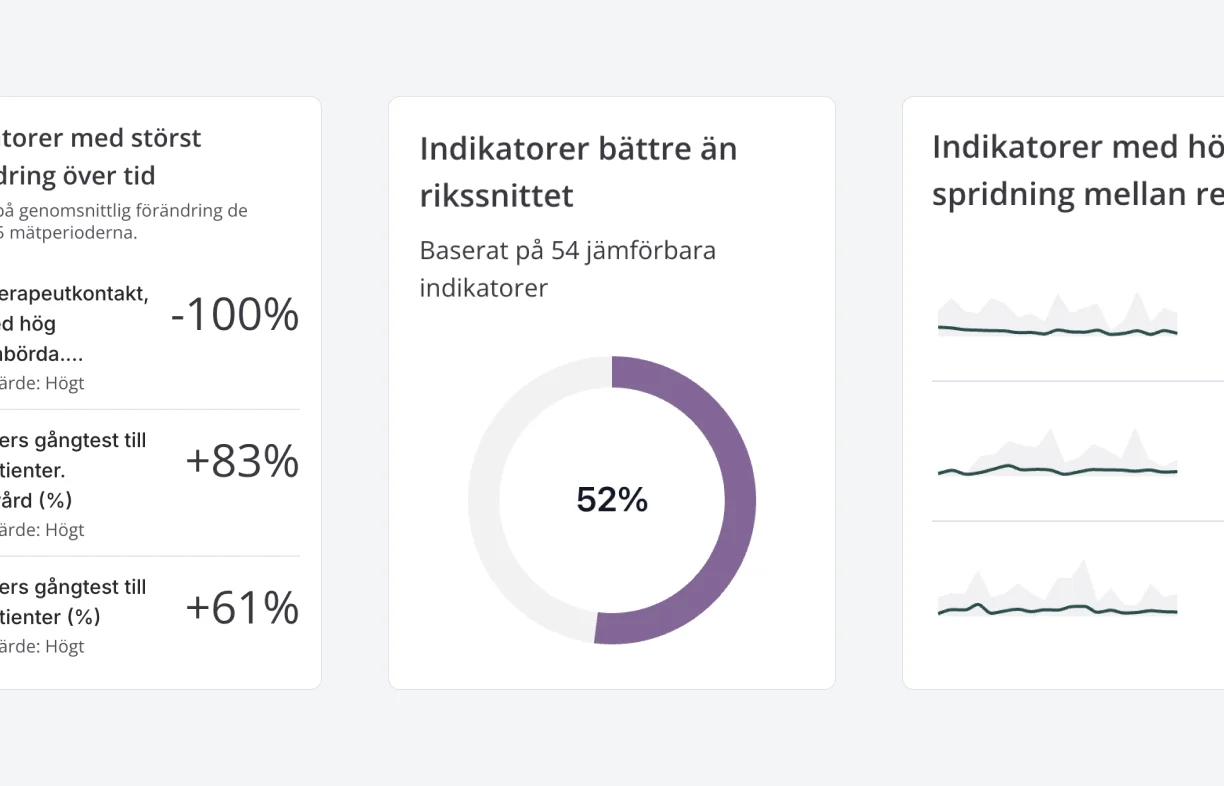
Hospital and healthcare region pages have insight cards that analyze the unit's own data. They show the share of indicators where the unit does better than the national average, how it performs against target levels, and which indicators changed most over the last five periods.
Data export and an open API
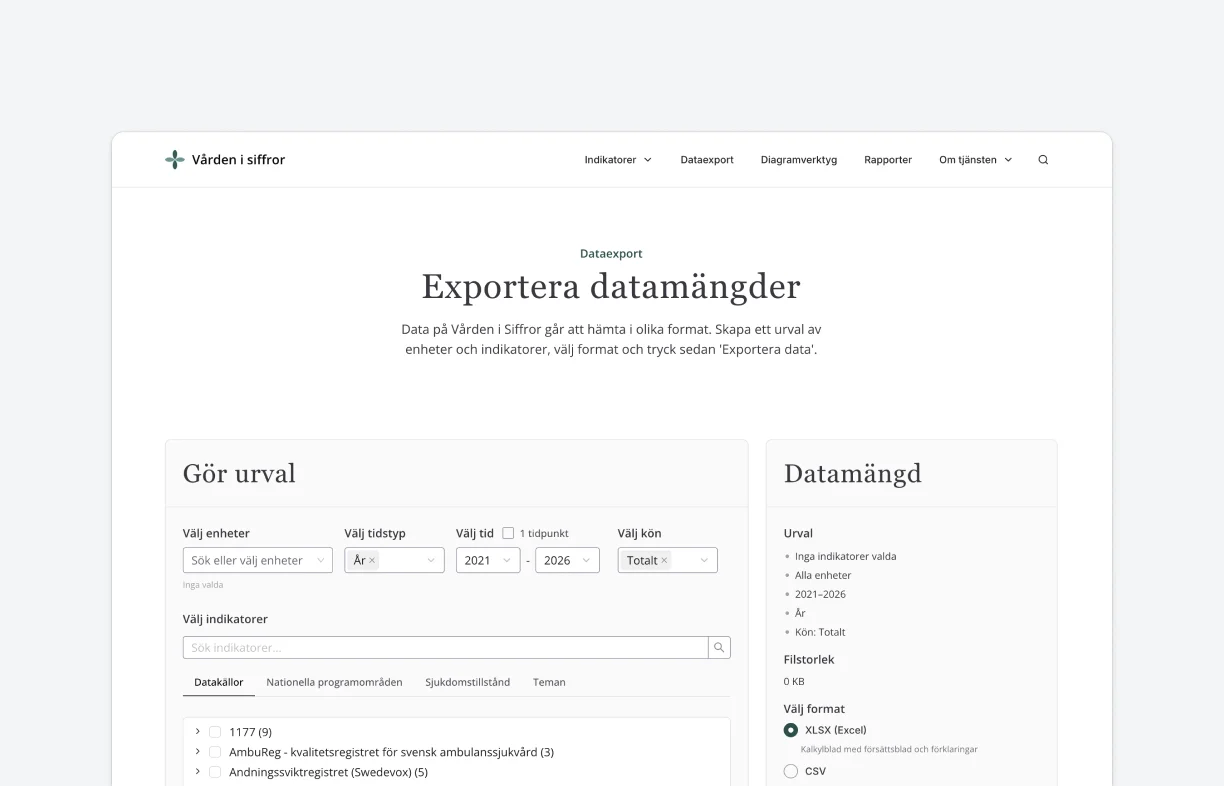
The data export page lets visitors download data as JSON, CSV, Excel or ZIP. There's also an API with its own documentation page, so developers and analysts can fetch the data from code.
In-depth indicator pages
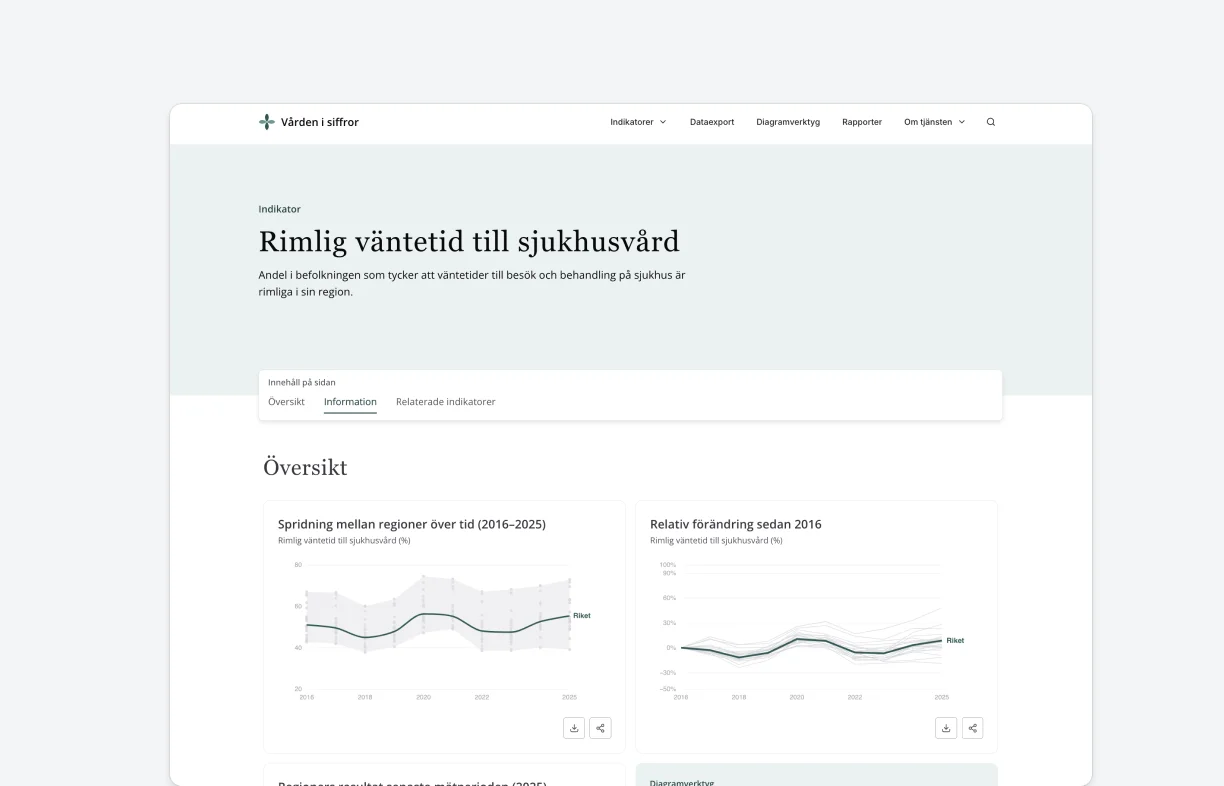
Every indicator has its own page. Three charts show how results vary between regions over time, how they have changed since the first measurement and how each region performed most recently. Below them are the definition, target level, interpretation advice, source and related indicators.
Technology
Custom data pipeline
Vården i siffror brings together data from more than 100 sources that is fetched and curated by a custom pipeline. This pipeline is designed to integrate with intermediate API layers and transform the statistical data and metadata into a shape compatible with the Datastory platform.
Charts run on Datastory platform's data infrastructure
Indicators, regions and hospitals are modelled in the platform's knowledge graph, and the statistics are stored and queried through Datastory's metrics engine, which is built on ClickHouse. The site has its own chart layer on top of that, tailored for healthcare comparisons. Reports and news can also embed visualizations made in the Datastory platform directly.
Results
“When data becomes more accessible and easier to grasp, we create better conditions for moving from follow-up and analysis to concrete improvement and development of healthcare.”
 Johan KaarmeHead of the Department for Health and Social Care, SKR
The new Vården i siffror makes it easier to navigate around 1,200 indicators. An improved search helps users find relevant indicators and analysis faster, and the national program areas now have pages of their own.


Need to make big datasets accessible to the public?
Tell us what you want to publish, and we’ll show you how we’d build it.