

Nordic AI Health Map
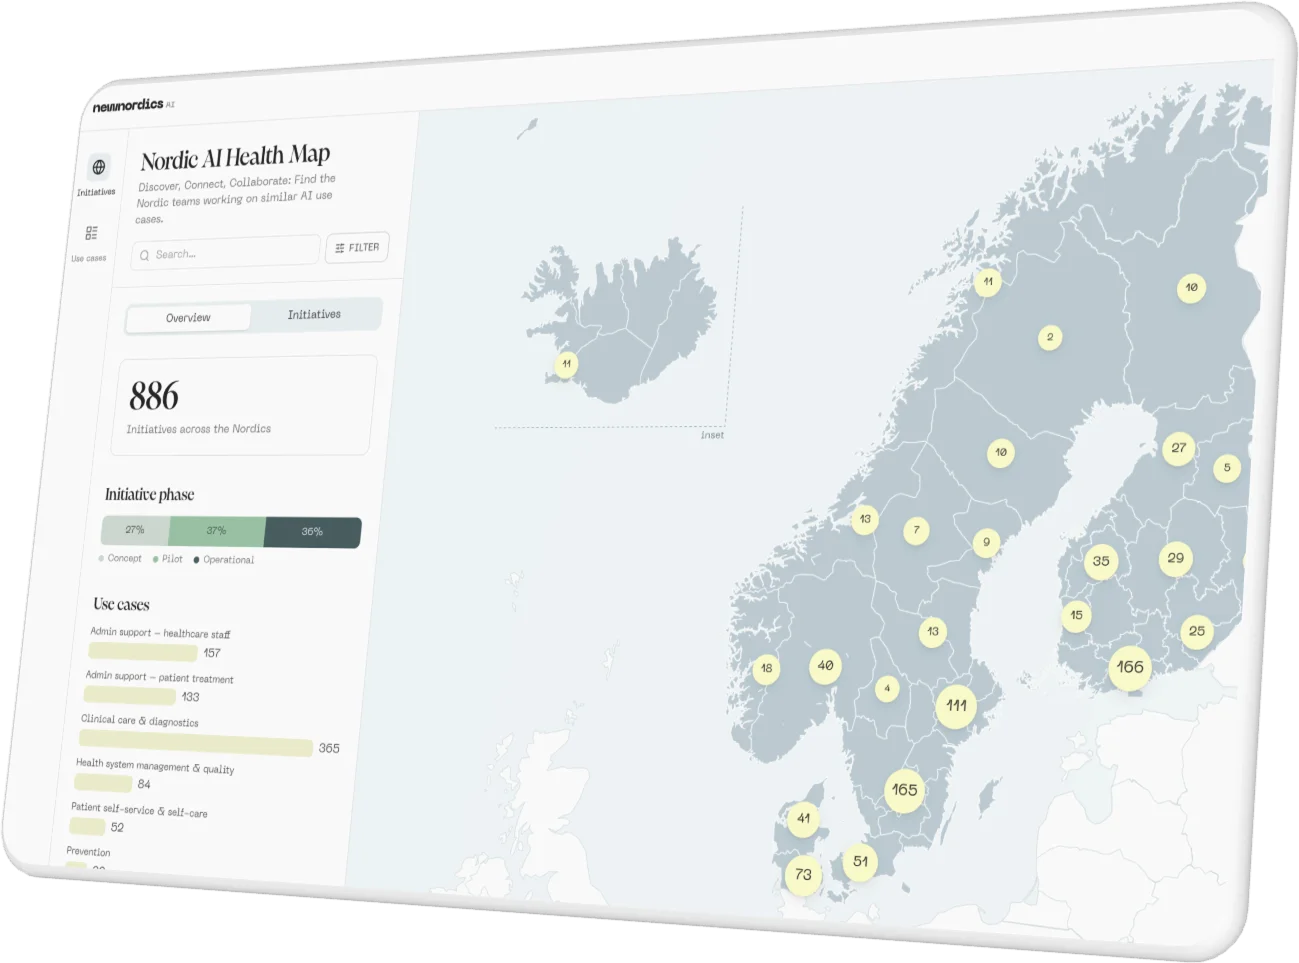
The Nordic AI Health Map gives the Nordic countries a shared overview of AI initiatives in healthcare, from national trends down to individual projects.
About
- Client
- New Nordics AI
- Solution
- Map application
- Sector
- Public sector
The challenge
AI is being developed and used across Nordic healthcare, but each country has kept track of its initiatives within its own healthcare system. Without a shared picture, it was hard to see who is working on what, and where teams in different countries are solving the same problem.
Value delivered
The Nordic AI Health Map brings more than 800 initiatives from Denmark, Finland, Iceland, Norway and Sweden into one interactive overview. Healthcare organizations, decision-makers and researchers can see where AI is used, how mature each initiative is and what it is for, and find peers to learn from across borders.
Background
New Nordics AI is a Nordic-Baltic center for applied AI, enabled by the Nordic Council of Ministers and anchored in national AI organizations such as AI Sweden. The Nordic AI Health Map is published on its website.
The map's development was led and coordinated by AI Sweden together with the Swedish E-Health Agency. A working group with representatives from all five countries agreed on a shared data model and set of use-case categories, and each country then collected data within its own healthcare system during the spring of 2026.
The contributions came from Danish Regions, Finland's wellbeing services counties through UNA, the Norwegian Directorate of Health's mapping KI Norge rundt, Iceland's Digital Health Agency and, in Sweden, AI Sweden and the Swedish E-Health Agency. Datastory was asked to turn these submissions into a map anyone can explore.
Solution
Datastory designed and built the Nordic AI Health Map as a map-first tool. The overview shows where initiatives are and how they are spread across three stages of maturity: concept or prototype, pilot, and operational use. A second view lists every initiative with its description, stage and use case.
Eight use-case categories, from clinical care and diagnostics to administrative support and prevention, each have a page of their own that summarizes common benefits, barriers and data types, and breaks the initiatives down by country and phase.
The visualizations were produced by Datastory on behalf of AI Sweden, with funding from the Nordic Council of Ministers' eHealth Group.
The visualizations
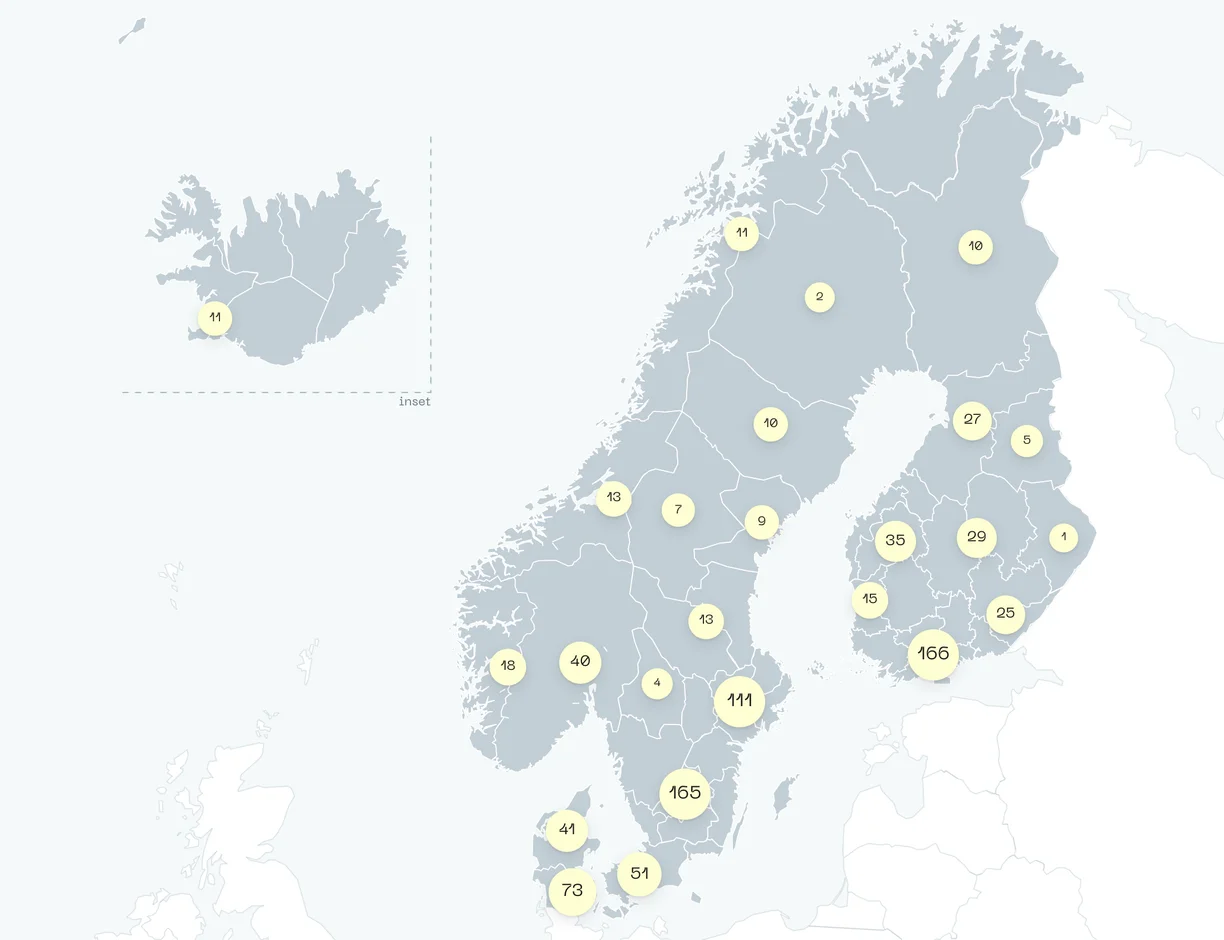
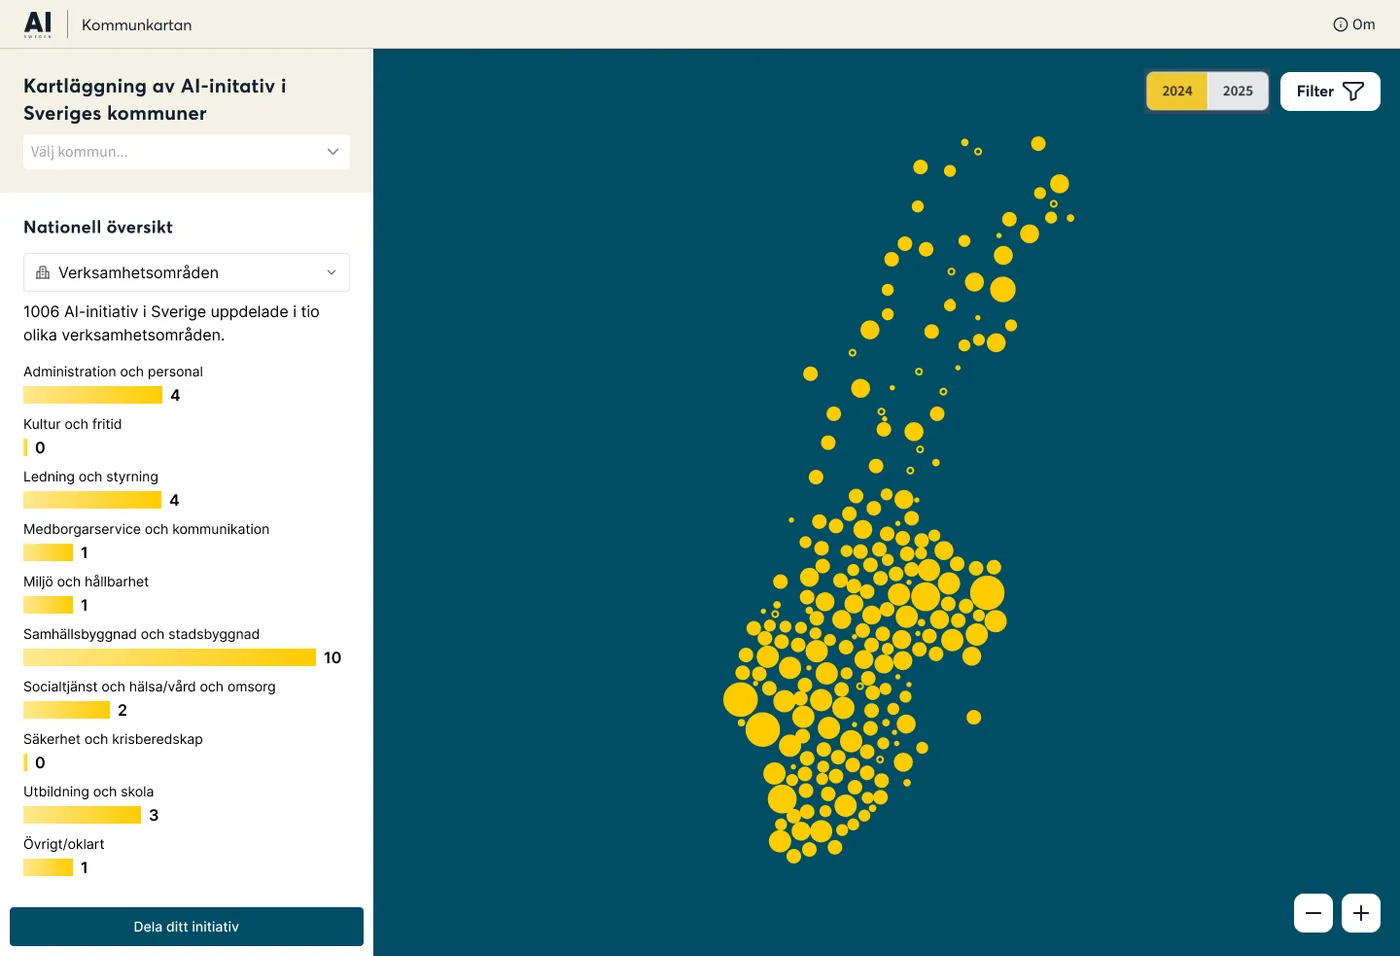
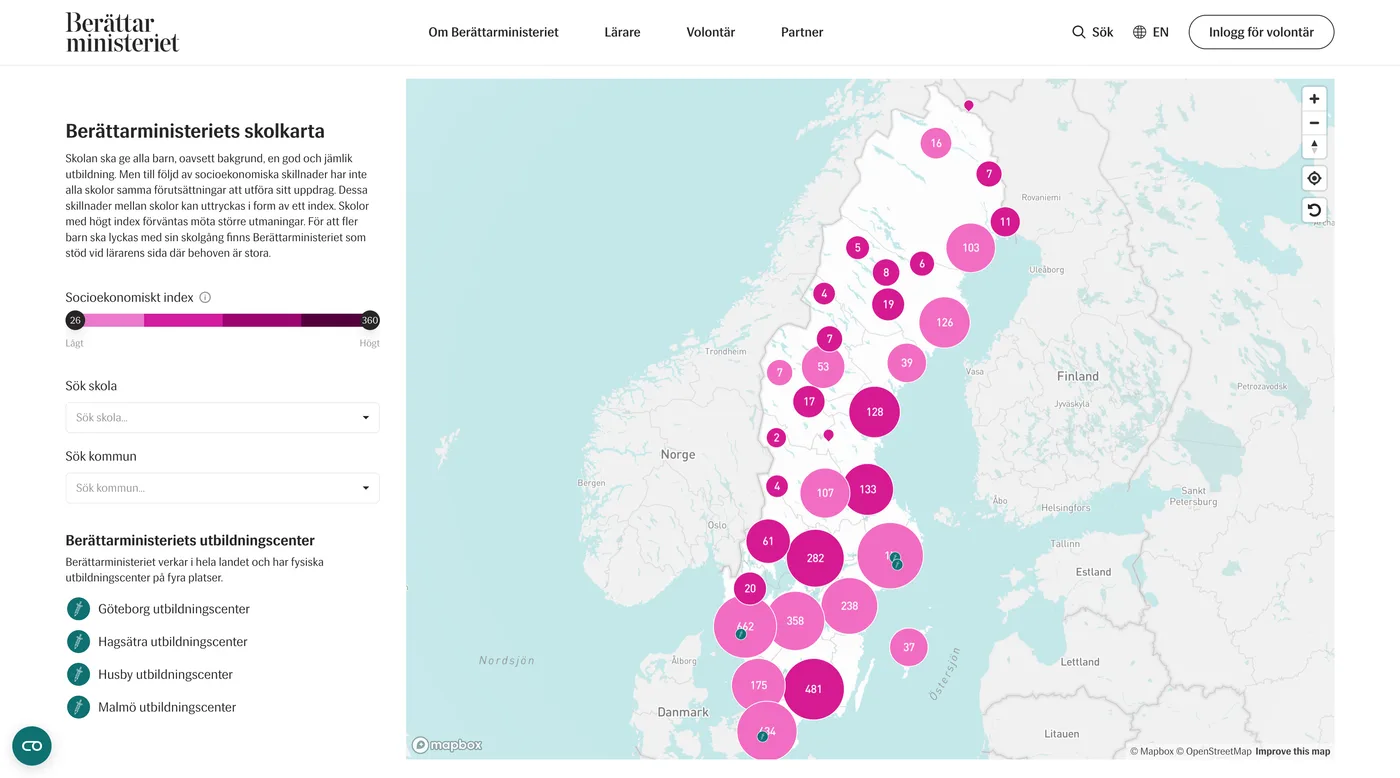
On the map, every region has a bubble that shows its number of initiatives and grows with it. Iceland sits in an inset beside the mainland, keeping all five countries in one view.
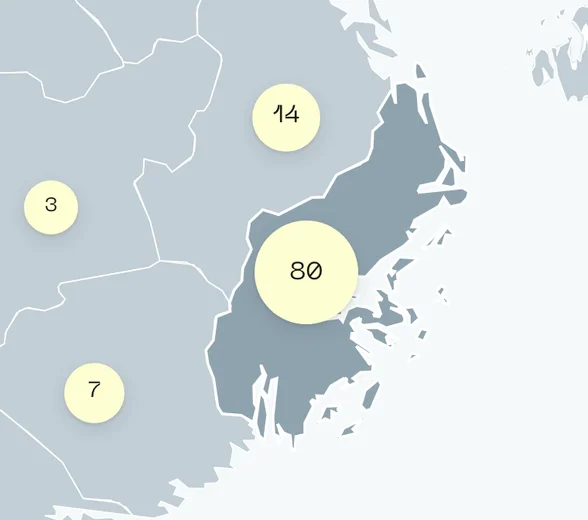
Selecting a region highlights it on the map and narrows the panel beside it to that region: its number of initiatives, how they split across the phases and how many there are in each use case.
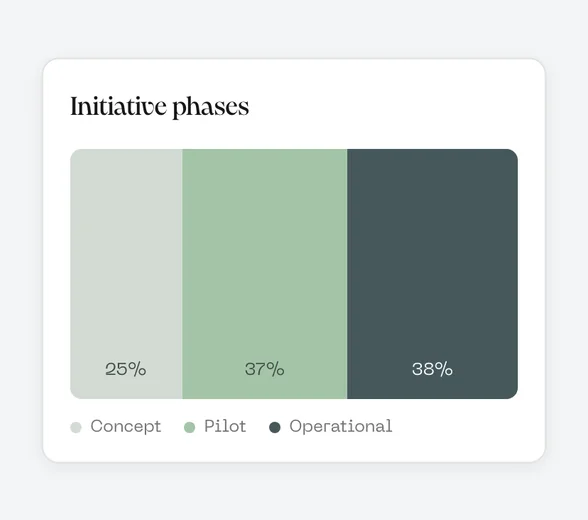
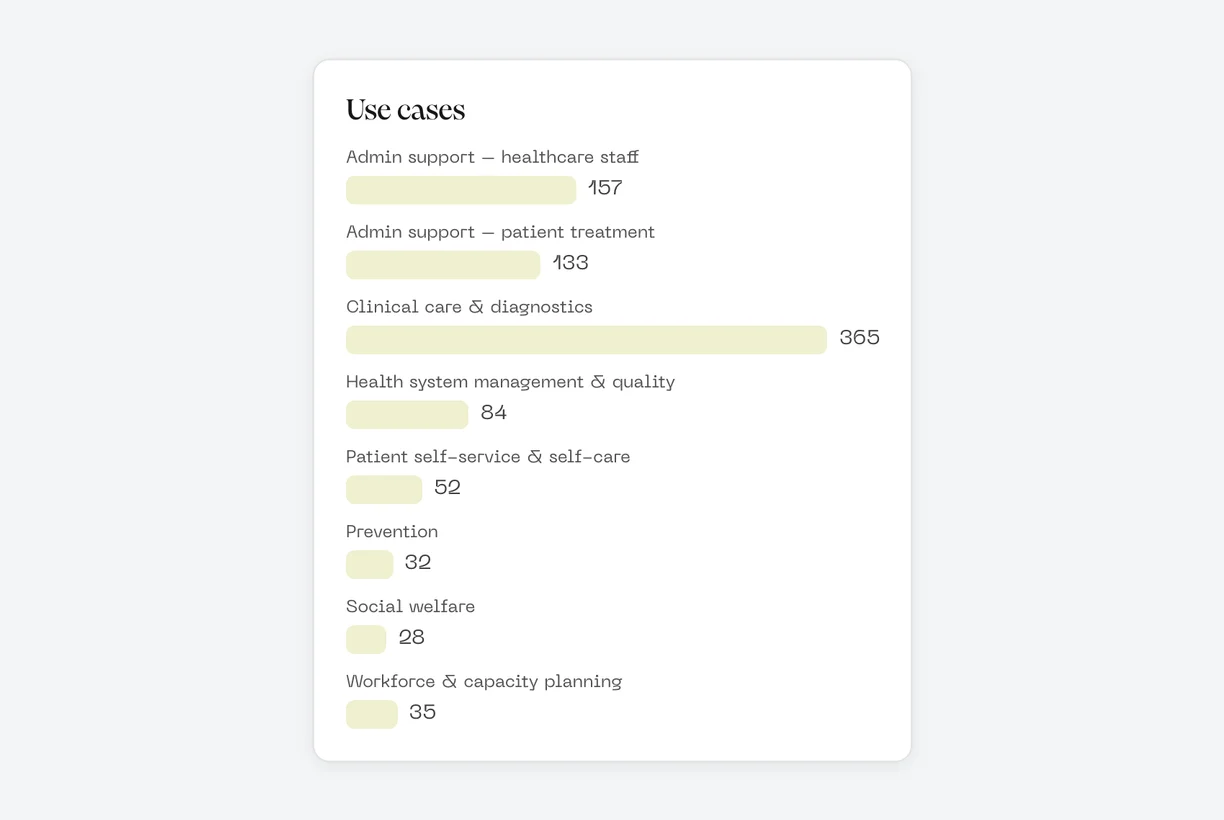
Bars show how the initiatives divide across the eight use cases, and a phase chart shows the shares in concept, pilot and operational use, in the same three colors throughout the tool. On each use-case page, the phase chart sits beside a count of initiatives per country.
Every initiative, one click away
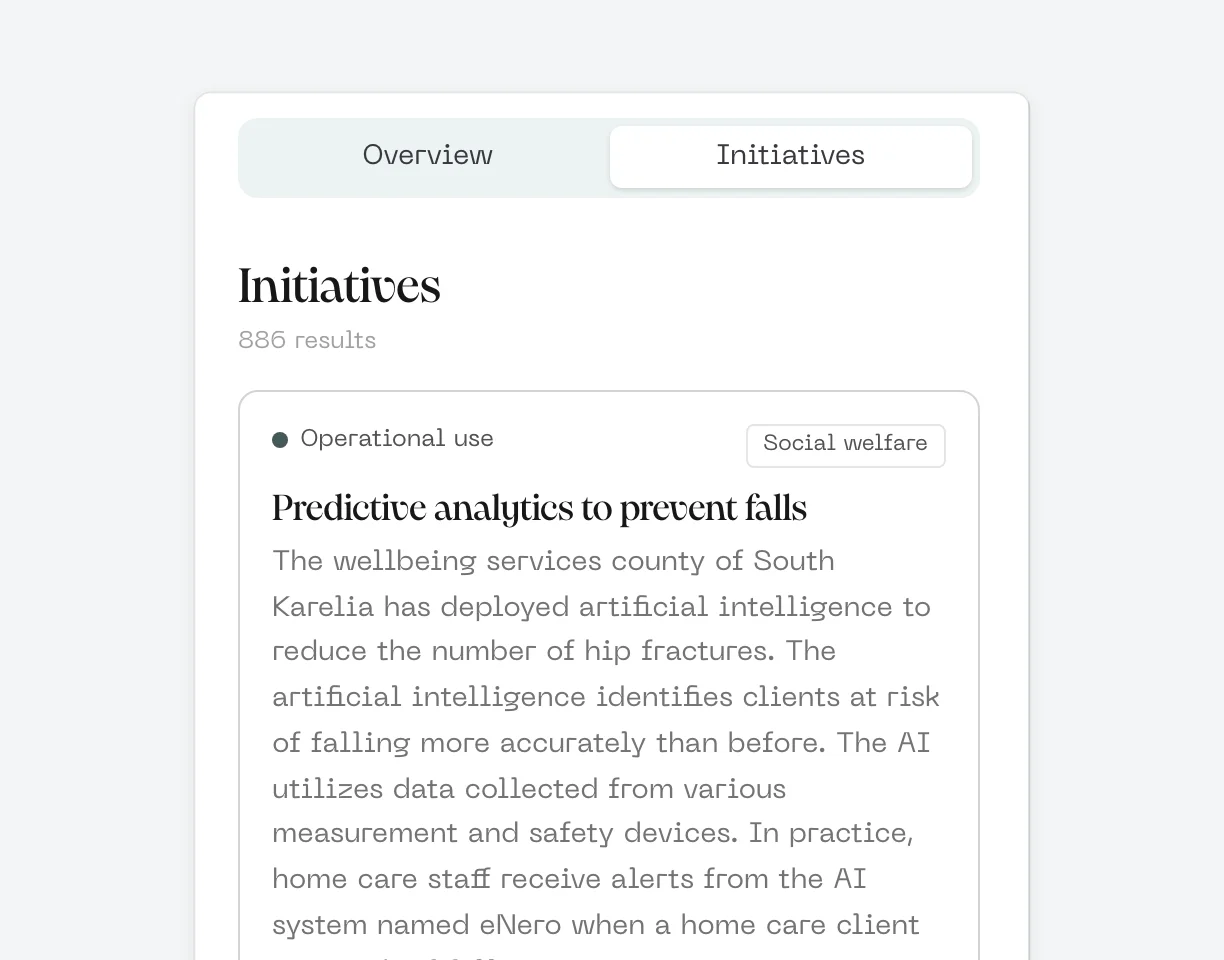
The map counts initiatives by region and merges neighboring regions into larger bubbles as you zoom out, so the whole Nordic region stays readable. The initiatives view lists each project with its stage and use case, and opening one tells you more about what it does.
Filter by what matters to you
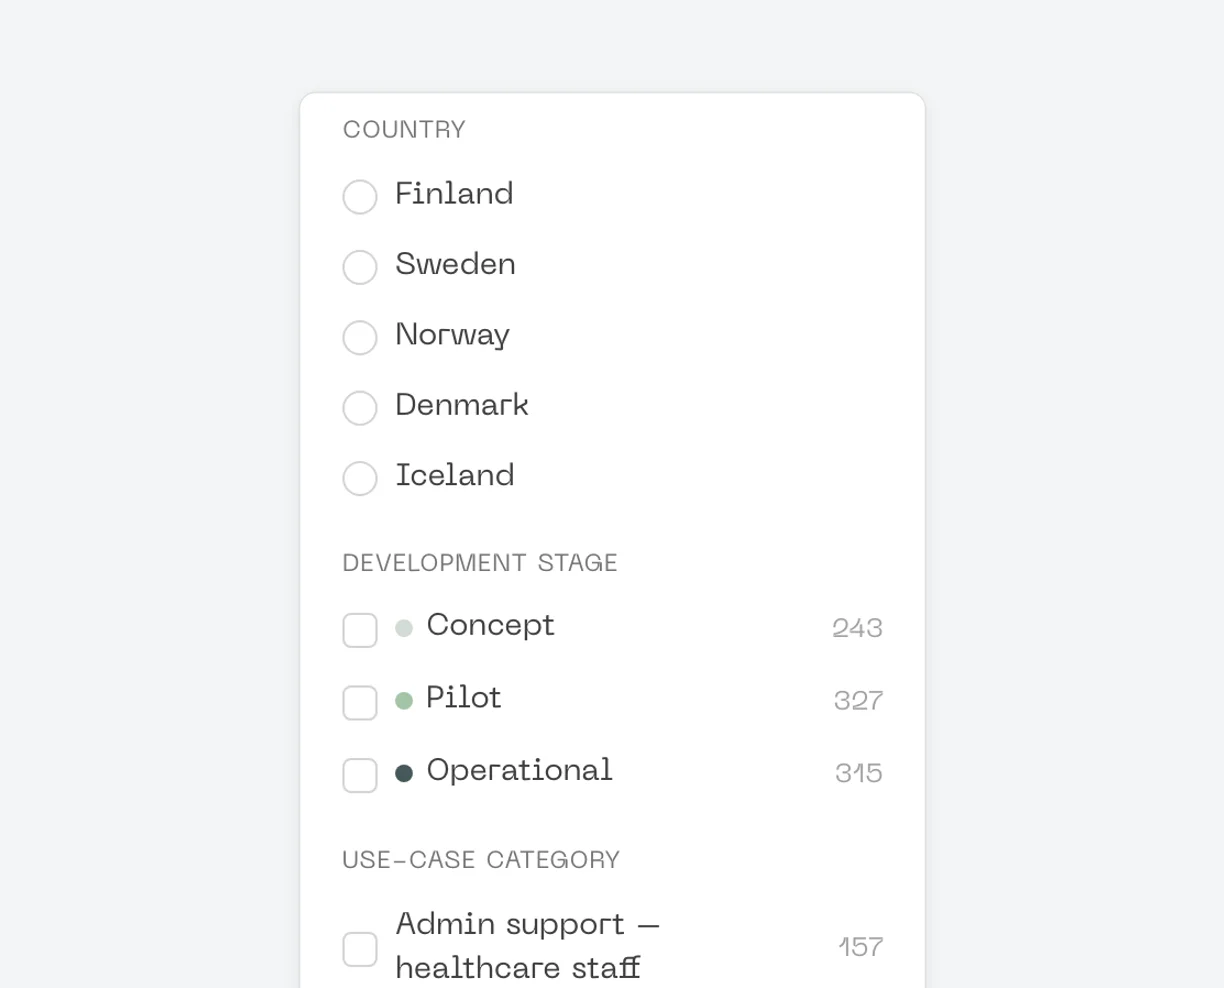
Filters for country, development stage and use-case category update the map, the counts and the list together. That makes it quick to answer questions such as which countries have AI in operational use for clinical care and diagnostics.
Technology
From spreadsheets to one dataset
Each country submitted its data in a shared Excel template, but the column layouts were not identical. A build script reads every submission by column header rather than position, normalizes the categories and produces a single dataset for the map.
A map that stays readable
The map is built with MapLibre GL, and region counts are clustered with Supercluster, so neighboring regions merge into one bubble when zoomed out and split again as you zoom in. Region boundaries were adjusted to match the level of detail the data actually has, such as Norway's four regional health authorities.
Built to be updated
The plan is to update the data every year. Because the map is generated from the country submissions, a new round of data collection can be published by rerunning the build rather than redesigning the tool.
Results
“This is exactly the sort of Nordic overview we need to be able to highlight solutions that work and scale up their benefits more quickly across the Nordic region.”
 Cecilia LeveauxRepresentative of the Nordic Council of Ministers on the board of New Nordics AI
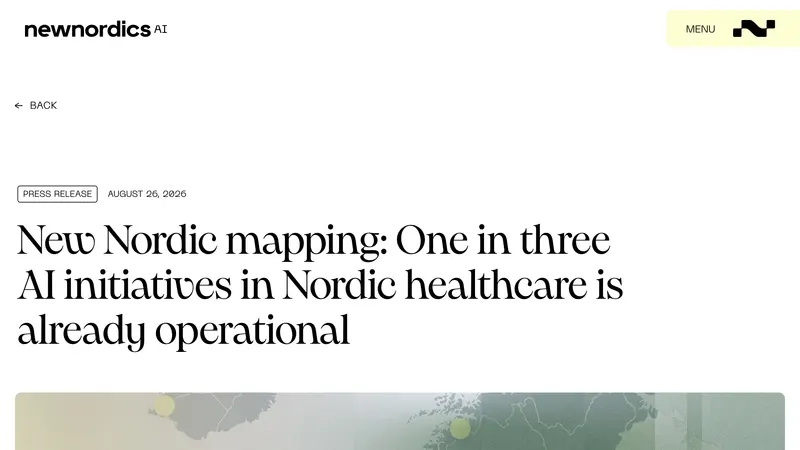
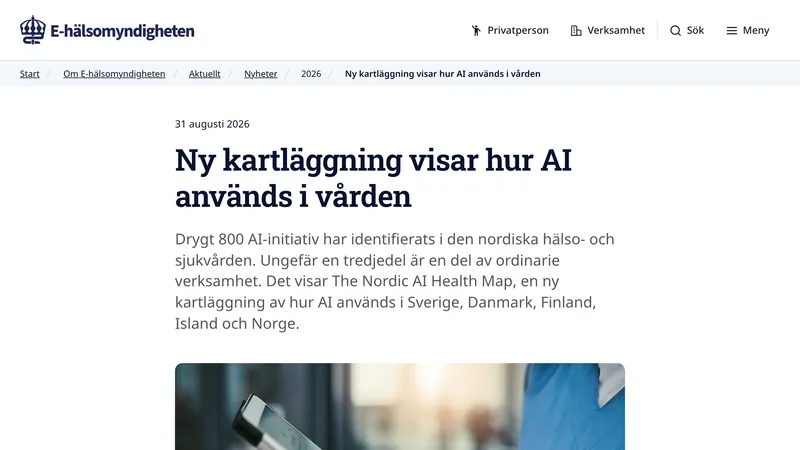
The map was launched on 26 August 2026 at the Nordic Conference on AI in University Hospitals, held at Karolinska University Hospital. Its first headline finding: about one in three AI initiatives in Nordic healthcare is already in operational use.
The Nordic AI Health Map gives healthcare organizations in five countries a shared, public picture of how AI is being adopted, from early prototypes to tools in everyday clinical use. By making initiatives visible across borders, it helps teams find others working on the same problems and learn from their experience.
The map is a snapshot rather than a complete inventory, and that is by design: it gives a representative picture of the landscape today, and a baseline to follow as the data is updated each year.
Publicity

Need to put your data on a map?
Tell us what you want to publish, and we’ll show you how we’d build it.